

Whether it’s manufacturing, or service industry delivering high-quality products/services are very important for the long-term success of any company. This is where the 5 core tools of quality come into play to help organizations to achieve operational excellence.
The 5 core tools of quality serve as pillars of quality, reliability, efficiency, and continuous improvement in organizations. Together these tools empower organizations to identify, prevent and eliminate defects at every stage of product development and process design.
In this article, I am going to discuss the 5 core tools of quality management i.e. APQP, PPAP, MSA, FMEA, and SPC in detail, their important components, implementations, practical applications, and benefits.
By mastering these tools you can help your organizations in the journey of achieving excellence. So, Are you ready to master these powerful quality management tools? Let’s get started…
Why Quality Management is Important?
Let’s imagine you want a new smartphone, the next day you started visiting all the mobile shops in the near marketplace. You want not just good looking smartphone but also includes all high-performance features.
At the end of the day, after visiting 4 to 5 smartphone shops finally you purchased one smartphone. After using a 3 months you realized that the battery performance of the smartphone is too poor. You feel completely disappointed here.
Because you expected a high-quality smartphone but your expectations were not fulfilled. That’s where quality management comes into play. QM is all about making sure that whatever products or services companies are providing should meet or exceed customer expectations.
It is one of the most important pillars of business that focus on providing customers best experiences with high-quality products and services. In today’s digital and internet world, customer expectations are too high.
They want products that not only have good built-in quality but also have high-performance features. That’s why QM is very important ever than before and so as the use of core tools of quality.
The 5 core tools of quality help organizations in identifying and eliminating defects/waste and continuously improving their processes. You can see the 4 important reasons why Quality management matters:
- QM helps businesses in providing high-quality products/services continuously to customers giving a company a competitive advantage. When customers see consistent quality products they are more likely to choose your company over your competitors.
- QM not only satisfies customers but also helps in cost reduction. By implementing Core tools of quality management business can identify and eliminate waste/defects which then saves money for organizations and improve profitability.
- QM promotes a culture of continuous improvement where everyone in the organization is encouraged to share new ideas, experiments, and innovative suggestions. This helps organizations move towards excellence.
- Most important QM helps businesses in satisfying customer expectations by producing high-quality products and services. When the customers are satisfied and happy, then the growth of the business is unlimited.
Understand 5 Core Tools of Quality Management:
The 5 core tools of quality management help businesses in building robust quality management systems that prevent defects, improve processes and deliver high-quality products or services to make the customer happy.
These 5 core tools of quality (APQP, PPAP, FMEA, MSA, SPC) are documented separately through the publication of manuals available through Automotive Industries Action Group (AIAG). These all tools now I am going to discuss one by one:
1. Advanced Product Quality Planning (APQP):
APQP is the best-structured approach to designing new products or processes that satisfy customers. In simple words, it is the planning for product quality in advance to ensure customer satisfaction.
Basically, APQP takes care of understanding the Voice of customers clearly and translating them into requirements, technical specifications, and characteristics. Then it uses these insights to design error-free processes/products to satisfy customer requirements.
It makes the organization think proactively about identifying quality-related problems before they become big and difficult to fix. It helps organizations manage the quality of their products from start to finish of the production process.
This is one of the most popular core tools of quality used in many companies. Let’s see the 5 phases of APQP that help companies in creating high-quality products.
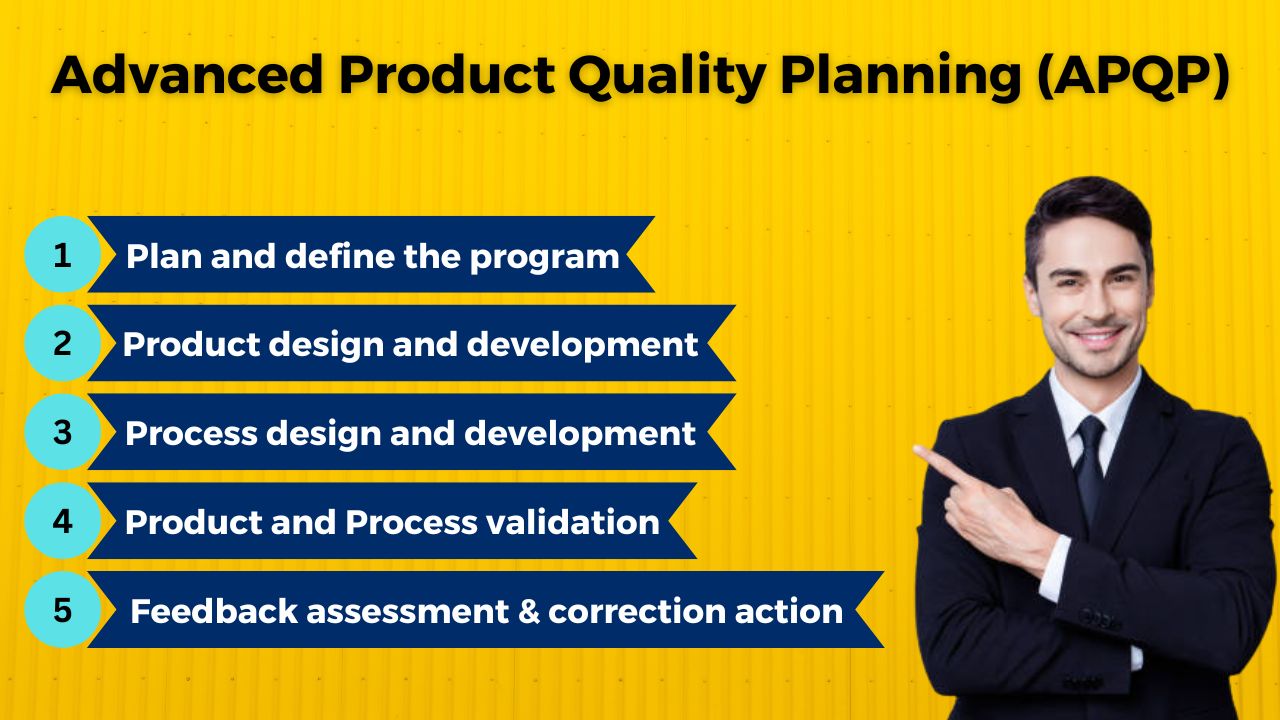
- Plan and define: In this phase, the organization establishes the project’s scope and objectives. Key activities in this phase are identifying customer requirements, defining measurable quality objectives, and determining the resources required for the project.
- Product design and development: During this phase, The team works on tasks including conceptualizing product features, building a prototype, and performing design reviews.
- The team ensures that the product meets customer requirements, as per regulation, and incorporates effective manufacturing processes.
- Process design and development: This phase is about developing robust manufacturing and assembly processes. The team works on process flowcharts, control plans, and process FMEA to identify and mitigate potential risks and failure points.
- Product and process validation: In this phase, the product and its associated process undergo thorough validation. To make sure that the product and the processes match the required standards, the team conducts testing, inspections, and audits.
- Feedback, assessment, and corrective action: This phase is about collecting feedback from various sources such as customers, suppliers, and internal stakholders. The team analyzes this feedback and identifies areas where corrective actions are required.
Benefits of APQP:
- By implementing APQP, you can detect and resolve potential issues or defects early on that prevents costly rework or repair later. This means fewer product failures and customer complaints hence ultimately reduction in the cost of product development.
- APQP streamlines the product development process by establishing clear milestones, responsibilities, and timelines. This leads to better coordination in the team as everyone knows their roles and hence it increases the efficiency in getting things done.
- APQP focus more on understanding customer needs and incorporating them into the product design and development process, which ultimately results in greater customer satisfaction.
- APQP helps in identifying potential risks early on and developing effective strategies to deal with them. By proactively dealing with potential risks, APQP actually reduces the chances of costly failures, delays, or any safety issues in the product.
- By analyzing data, monitoring product performance, and gathering feedback APQP helps you in identifying areas for improvement and taking corrective actions. It promotes a culture of continuous improvement in the organizations.
- APQP implementation helps organizations in creating high-quality products and services that satisfy customer expectations.
The leading tech and automotive businesses in the world, including Apple, Samsung, and General Motors, Ford have successfully implemented APQP. These businesses increased the caliber of their goods while gaining a competitive edge.
2. Production Part Approval Process (PPAP):
PPAP is developed by the Automotive Industry Action Group (AIAG) and this core tool of quality is a comprehensive part of APQP. As you know that there are 5 phases of APQP so this PPAP comes into action in the 4th phase of APQP i.e. Product and process validation.
The Production Part Approval Process (PPAP) is a standard procedure that facilitates communication and approval of production designs and processes between manufacturers and suppliers.
The purpose of PPAP is to verify that the processes used to create parts can reliably repeat the parts at stated production rates during normal production runs. It was developed in an effort to encourage a greater understanding of the requirements of manufacturers and suppliers.
PPAP is a safety net for production because it ensures every part of your product is thoroughly tested and meets the necessary standards before it goes into production. It guarantees that your product is trustworthy, safe, and up to customer standards.
Let’s see the overview of step by step PPAP process:
- The manufacturer receives the customer’s requirements and specifications.
- They gather all the necessary documentation, like engineering drawings and specifications.
- They produce samples of the product based on the specifications.
- These samples undergo rigorous testing and inspection to ensure they meet the desired standards.
- The manufacturer creates a control plan, outlining the steps and checks needed during production.
- Once everything is in order, the manufacturer submits the PPAP package to the customer for approval.
- The customer reviews the package, checking if all the requirements are met and if the production process is reliable.
- If everything looks good, the customer gives the green light for production to begin.
- Throughout production the manufacturer follows the control plan, conducts regular inspections, and monitors the process to maintain consistent quality.
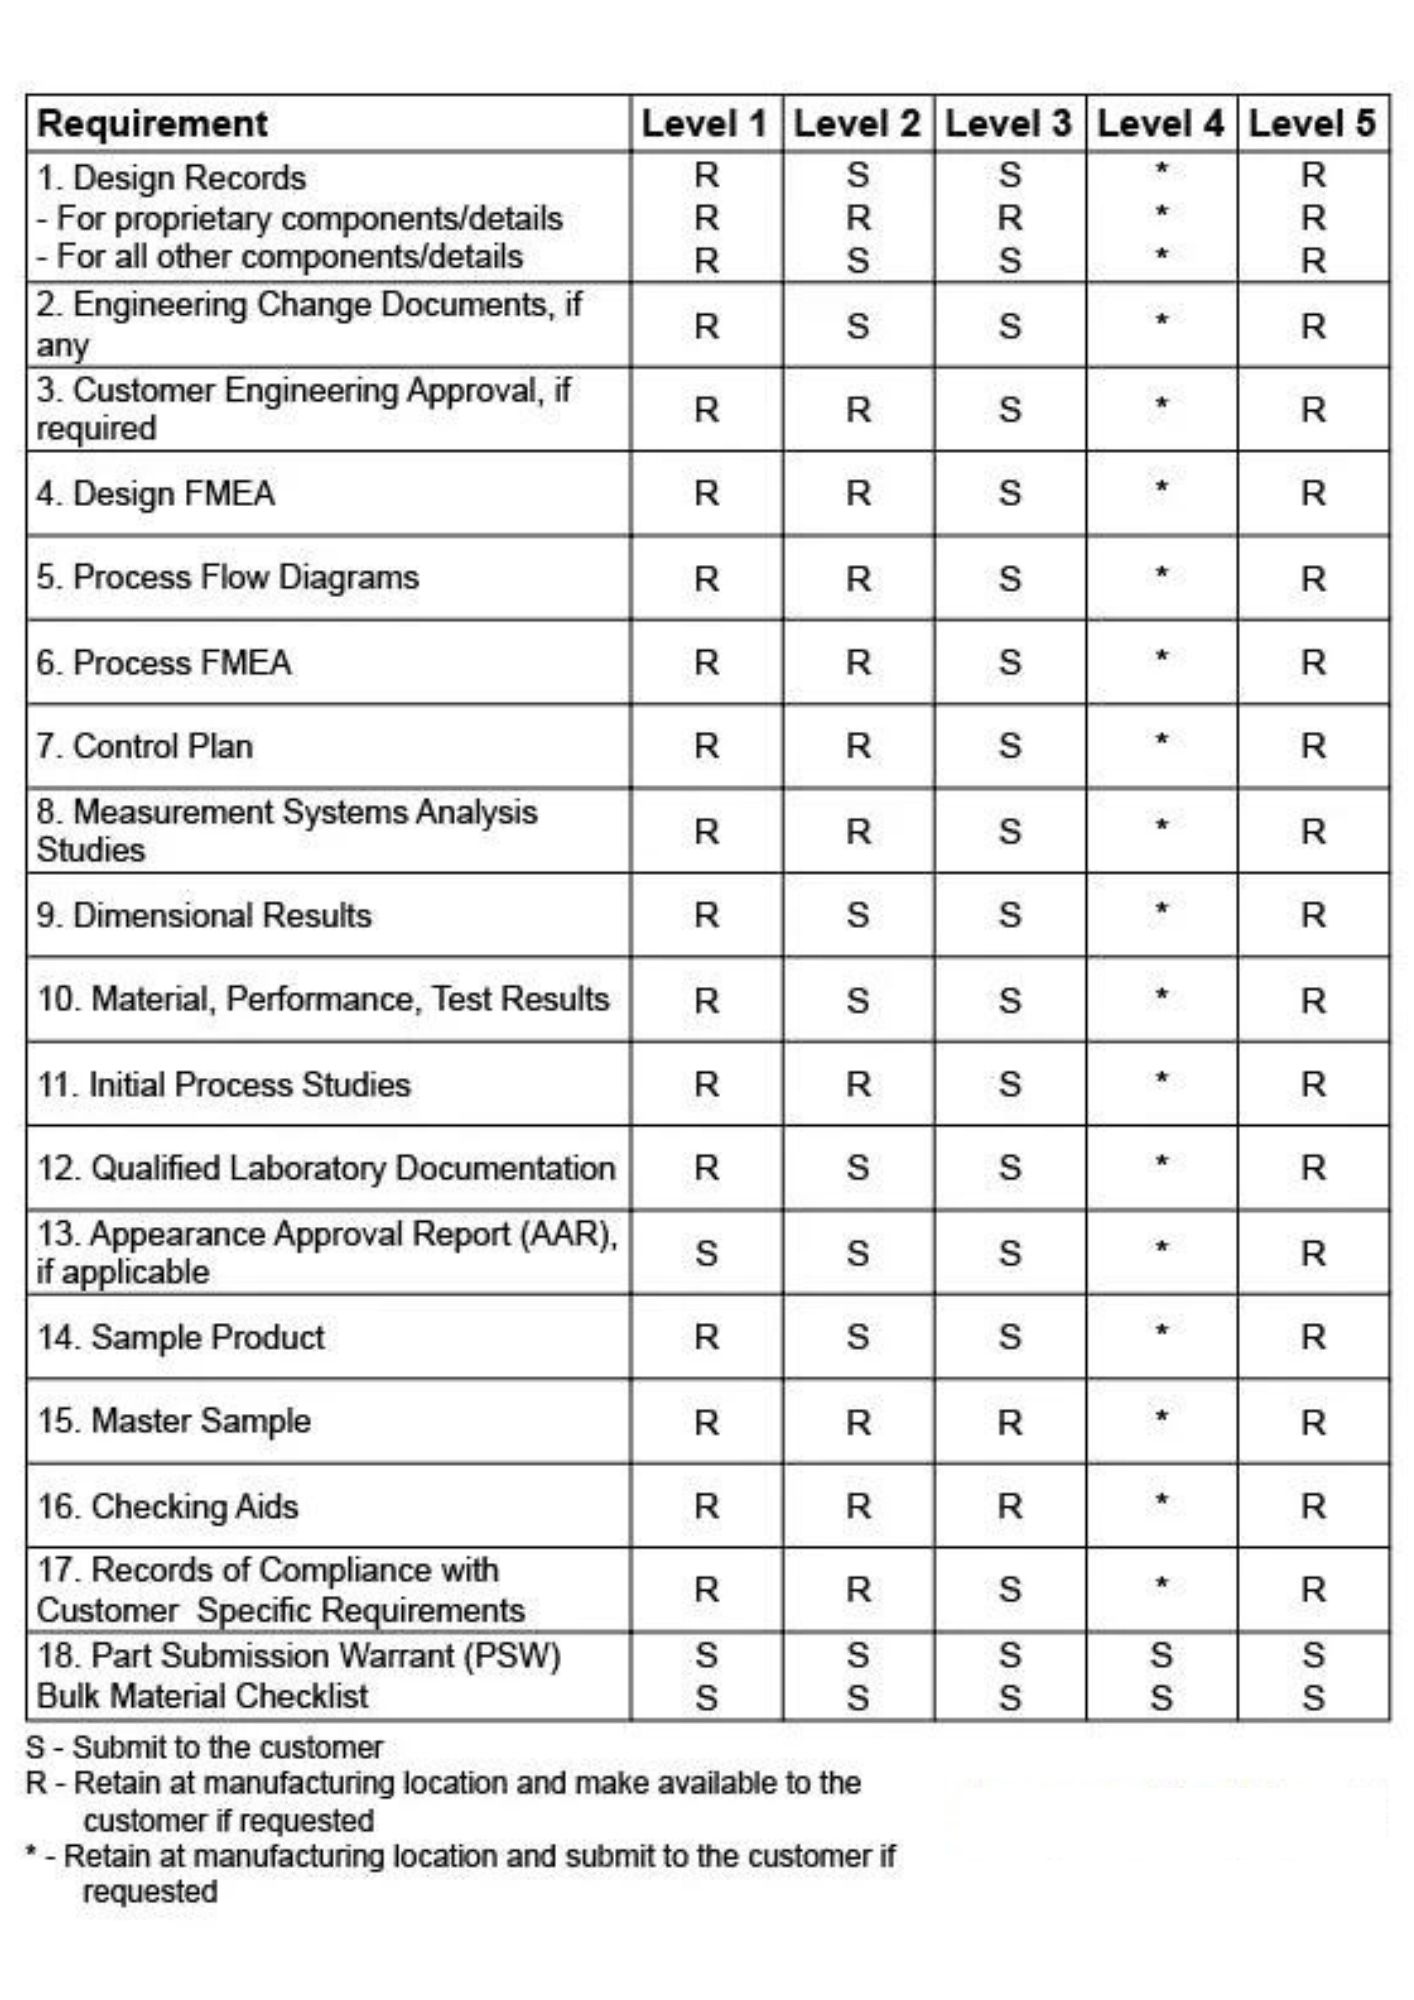
The PPAP process consists of 18 elements that required approval for producing different level parts. PPAP report reviews the below listed 18 elements to validate and approve the parts.
- Design records
- Authorized engineering change documents
- Customer engineering approval
- Design failure modes and effect analysis (DFMEA)
- Process flow diagram
- Process failure modes and effect analysis (PFMEA)
- Control plan
- Measurement system analysis
- Dimensional results
- Record of material/performance test results
- Initial process studies
- Qualified laboratory documentations
- Appearance approval report (AAR)
- Sample production parts
- Master example
- Checking aids
- Customer-specific requirements
- Part submission warrant (PSW)
There are 5 levels of PPAP report submission, depending upon what steps of the approval process are needed by the customer. (See here I am just giving you an overview of all 5 core tools of quality. I will discuss each tool in upcoming articles.)
- Level 1:- Production warrant and appearance approval report only submitted to the customer.
- Level 2:- Production warrant, product samples, and dimensional results.
- Level 3:- Production warrant, product samples, and complete supporting documents.
- Level 4:- Production warrant and other documents as instructed by the customer.
- Level 5:- Production warrant, product samples, and other supporting documents. (At this stage review is conducted at the suppliers manufacturing location)
Benefits of PPAP:
- PPAP sets clear standards and requirements for the parts used in production. These guidelines can help manufacturers streamline their procedures and guarantee the same high standard of quality across all of their goods.
- PPAP involves various stakholders like suppliers, manufacturers, and customers. Suppliers provide detailed documentation about the parts they deliver, and manufacturers carefully review and approve these submissions.
- This process encourages collaboration, open communication, and a strong bond of trust as well as transparency.
- PPAP helps minimize risks like faulty components by identifying any problems before production starts. By identifying and resolving such risks in early-stage, manufacturies save a lot of money and time, that would otherwise be wasted on rework or repair.
- PPAP ensures that the parts used in manufacturies are up to the mark and meet required specifications. By carefully evaluating and approving each part, manufacturing can prevent defective products from reaching the market.
- Many industries have specific regulations and standards that need to be met. PPAP helps companies demonstrate compliance with these requirements.
- By meeting industry requirements, companies can gain a competitive edge and maintain a good reputation within their industry.
3. Failure Mode Effect Analysis (FMEA):
The next powerful tool from the 5 core tools of quality is Failure Mode Effect Analysis. FMEA is a systematic approach to evaluating a process or product to determine how the process or product could fail and the failure effects.
FMEA is a living document and its main goal is to recognize the potential effects of failure occurrence and to identify actions that will reduce or eliminate the probability of the failure occurring.
Documenting the analysis and FMEA end results, maintaining them, and periodically reviewing the results, actions, and analysis can help improve process or design costs and reliability.
In simple words, failure modes are the ways in which a process can fail and effects are the ways that these failure modes can lead to waste and defect. The Job of FMEA is to identify, prioritize and take corrective actions to limit such failure modes.
There are main 4 types of FMEA that most industries use:
- System FMEA: Performed on a product or service product at the early concept/design level when various modules all lie together. All the module-level FMEAs tie together to form a system.
- Fg: Electrical system of the car consists of modules like a battery wiring harness, lighting control, regulator, etc. System FMEA focuses on potential failure modes associated with the modules of a system caused by design.
- Design FMEA: Performed early in the design phase to analyze product fail modes before they are released to production. The purpose is to analyze how fail modes affect the system and minimize them.
- Process FMEA: Performed in the early quality planning phase of manufacturing to analyze the failure modes of the manufacturing and transactional processes that may escape to the customer. The failure modes and the potential sources of defects are rated and the corrected action is taken based on Pareto analysis.
- Equipment FMEA: This is used to analyze the failure modes in the equipment used in a process to detect or make the part. Eg: Test equipment fails modes to detect open and short circuits.
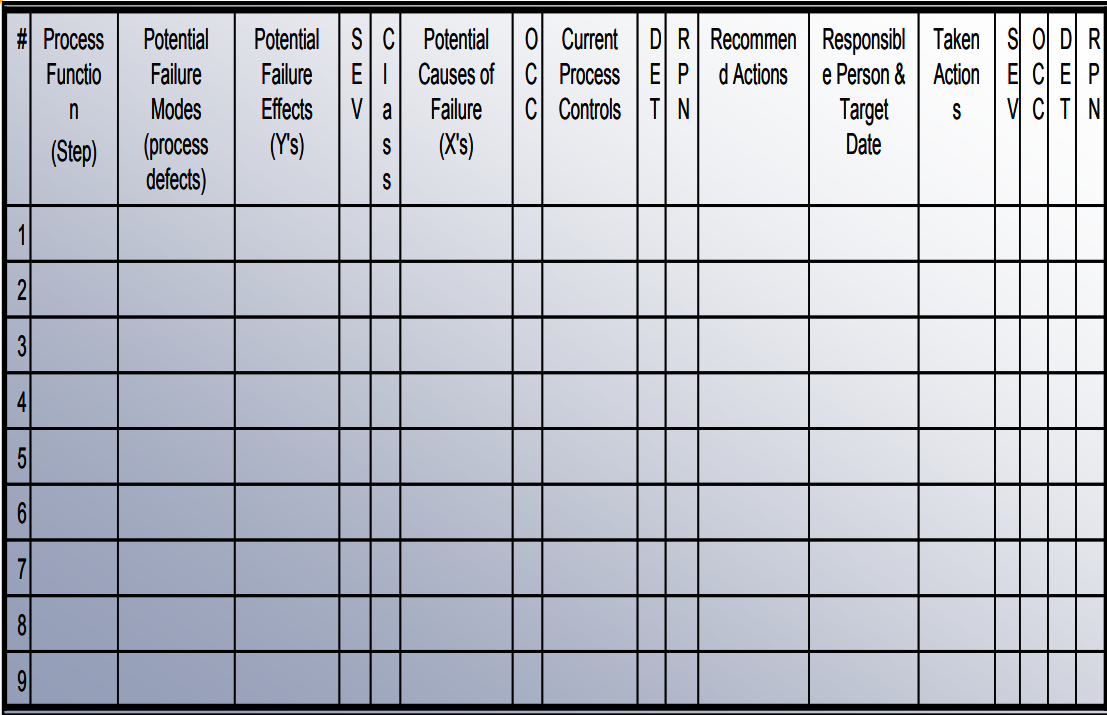
There are some important factors that are generally used during the development of FMEA. Let’s understand those factors one by one:
- Severity (S): This factor assesses the seriousness or impact of the potential failure mode. Think of it as a scale of how bad things can get if something goes wrong. This helps you to prioritize the focus on the most critical risks.
- Occurrence (O): This factor looks at the likelihood of a failure mode occurring. It’s like predicting the probability of something going awry. With the understanding of this, you can focus on preventing the most probable failures.
- Detection (D): This factor is early detection of failure. It examines how likely it is for you to catch a failure mode before it affects the customer. You can prevent failures by enhancing detection.
- Risk Priority Number (RPN): This is a numerical value obtained by multiplying S×O×D. If failure mode has high severity, high occurrence, and low detection, then the RPN number will be high that signals high priority risk.
Benefits of FMEA:
- FMEA is a proactive approach that enables you to identify and anticipate potential failure modes in a process, product, or system right from the start. This early identification of failure mode helps stops the costly disaster later.
- FMEA helps you prioritize your resources and focus by assessing the severity of each failure mode and its likelihood of occurrence. By doing this you can put efforts towards high-priority risks, and ensure to tackle the most crucial issues first.
- By analyzing failure modes, their causes, and potential effects, you gain valuable insights into how to make your products and processes more robust and reliable. You identify design flaws, weak components, or faulty procedures and take proactive measures to eliminate or mitigate them.
- By identifying potential failures in advance FMEA helps you avoid expensive rework/repair or customer complaints. You can optimize maintenance schedules, preventing unexpected breakdowns and costly downtime.
- By preventing failures, improving quality, and reducing defects with the help of FMEA you deliver high-quality products and services that meet or exceed customer expectations.
- By regularly performing FMEA, you encourage a culture of continuous learning, innovation, and improvement. You uncover new failure modes, refine your knowledge, and implement corrective actions.
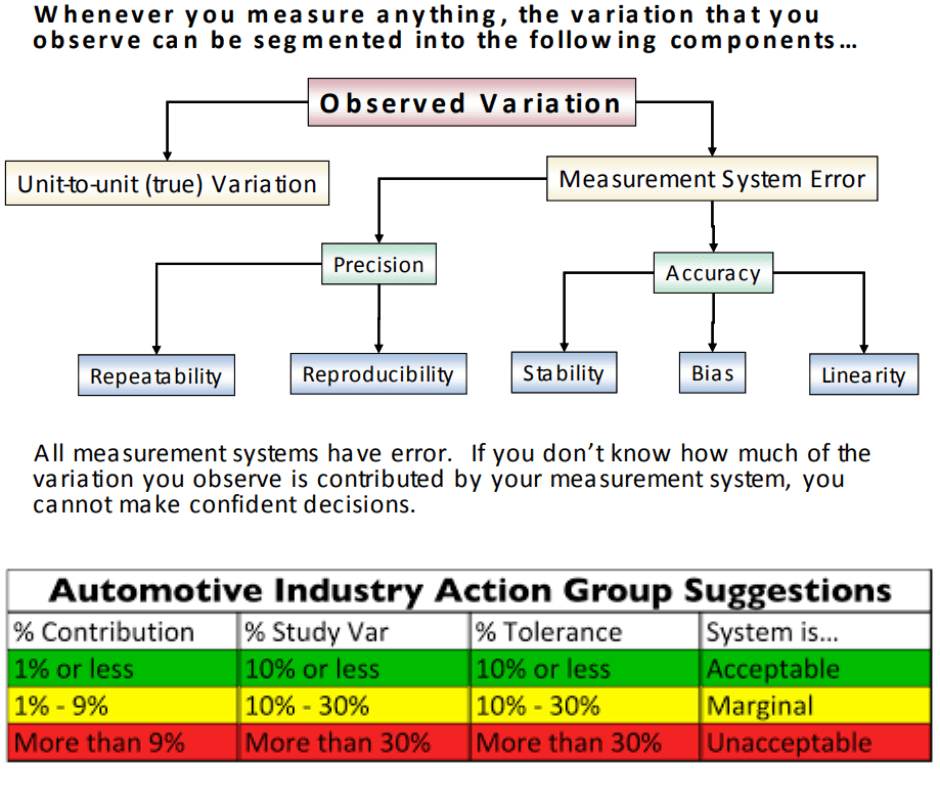
4. Measurement System Analysis (MSA):
The 4th tool from the list of core tools of quality is measurement system analysis. MSA is done to make sure that the measurement instruments of adequate capability are available for taking measurements on the product characteristics and product or process variables of a given process.
This analysis assesses the quality of the measurement system. It determines how much variation in the measurement system contributes to the overall process variability and ensures that variation in the measurement system is minimum compared to process variation.
By conducting MSA, organizations can identify and quantify the measurement system’s errors, determine the magnitude of these errors relative to the process variability, and take appropriate actions to improve the measurement system.
This helps in reducing measurement errors, enhancing process understanding, and making reliable data-driven decisions for process improvement and control.
There are 5 main components MSA looks for. Let’s see them one by one.
- Bias: The difference between the average measured value and a reference value is referred to as bias. The reference value is an agreed-upon standard, such as a standard traceable to a national standards body.
- Stability: It is the total variation in the measurements obtained with a measurement system on the same parts when measuring a single characteristic over an extended time period. A system is said to be stable if the results are same at different points in time.
- Linearity: It is the difference in bias values throughout the measurement range in which the gauge is intended to be used. This tells you how accurate your measurements are throughout the expected range of the measurements.
- Repeatability: It is the variation in measurements obtained with one measurement instrument when used several times by one operator while measuring the identical characteristic on the same part. (Measuring the same part by the same operator multiple times)
- Reproducibility: It is the variation in the average of the measurements made by different operators using the same measuring instrument when measuring the identical characteristic on the same part. (measuring the same part by different operators)
The MSA technique called the Gage R&R study is used to assess the measurement system. This involves evaluating the repeatability and reproducibility of a measurement system.
This technique helps identify if there are any inconsistencies in the measurement system caused by the operators or the measurement devices. On the other hand, the Gage bias study is used to determine if the measurement instrument is taking measurements accurately.
Benefits of MSA:
- MSA helps identify and quantify the sources of measurement error, allowing for better interpretation of data and reducing the risk of making incorrect decisions because with the help of MSA organization makes more informed decisions based on accurate data.
- MSA provides insights into the variability and stability of the measurement system, which helps organizations to identify and address issues affecting the measurement process. Reduce measurement errors and the likelihood of producing defective products.
- MSA helps to separate the inherent process variability from the measurement system variability, which ultimately helps in improving process capability and achieving better overall performance.
- MSA ensures that the measurement data used for monitoring and controlling processes are accurate as well as reliable, which helps organizations deliver consistently high-quality products and meet customer requirements.
- MSA helps identify measurement errors and then by addressing these errors organizations minimize the errors (rework/repair), reduce waste and avoid unnecessary expenses associated with incorrect measurement or faulty data.
5. Statistical Process Control (SPC):
The last and one of the best core tools of quality is statistical process control. This statistical method helps monitor and control processes to make sure they operate within the quality parameter set by the process owner.
It’s all about keeping things in check and ensuring that products meet the highest standard. Every process has known variations called special cause variation and common cause variation.
Common cause variations are intrinsic to the process and always present in the process. On the other hand, Special cause variations are unnatural variability because of assignable causes or pattern changes in the process.
SPC is used to detect special causes of variation in order to have those operating the process find and remove the special cause. When a special cause has been detected in the process, the process is considered to be out of control.
SPC gives an ongoing look at the process capability. It is not a capability measurement but it is a visual indication of the continued process capability of the process.
SPC is used primarily to act on out-of-control processes, but it is also used to monitor the consistency of processes producing products and services.
The primary SPC tool is control charts, it is the graphical representation for specific quantitative measurements of a process input or output.
SPC uses control charts to visualize process performance, identify variations and provide data analysis to make an informed decision about the process.

Control charts are time series charts of all the data points with one addition. The standard deviation for the data is calculated for the data and two additional lines are added. (See the above image)
These lines are placed +/- 3 standard deviations away from the mean and are called the upper control limit (UCL) and lower control limit (LCL). Not that chart has 3 zones:
- The zone between UCL and LCL or the zone between +3 standard deviation and -3 standard deviation called as Zone of the common cause of variation.
- The zone above the UCLor zone above +3 standard deviation is called a zone of special cause variation.
- Similarly, the zone below LCL or zone below -3 standard deviation is called a zone of special cause variation.
The control charts graphically highlight data points that do not fit the normal level of expected variation. This is mathematically defined as being more than +3/-3 standard deviations from the mean.
In a nutshell, Control charts provide you with two basic functions. The 1st is to provide time-based information on the performance of the process which makes it possible to track the events affecting the process.
And the 2nd is to alert you when special cause variation occurs. There are different types of control charts that can be used depending on the type of data or different causes.
- X bar R chart: The X bar chart monitors the average of a process and the R chart monitors the variability of a process using range.
- X bar S chart: The X bar chart monitors the average of a process and the S chart monitors the variability of a process using standard deviation.
- I-MR chart: The I chart monitors the individual measurements of a process and the MR chart monitors the range between consecutive individual measurements.
- P chart: The P chart is used to monitor the proportion or percentage of defective items or non-conformities in a process.
- NP chart: The NP chart is used to monitor the number of defective items or non-conformities in a process when the sample size remains constant.
- C chart: The C chart is used to monitor the number of defects per unit in a process when the sample size may vary.
- U chart: The U chart is used to monitor the average number of defects per unit in a process when the sample size may vary.
Benefits of SPC:
- SPC allows you to detect process variations and abnormalities early on. By detecting variations early on, SPC helps you in taking proactive actions to prevent defects and non-conformities before they occur like reducing scrap, and rework.
- SPC provides insightful data about process behavior and performance. By analyzing the data collected over time, you can understand the common cause of variations and identify sources of defects.
- The information you get as the output of SPC allows you to target specific areas of improvement, prioritize resources and implement effective solutions to enhance process capability and overall process performance.
- SPC relies on data and statistical analysis for decision-making. By analyzing process data, SPC helps in making informed decisions about process adjustments, changes, or interventions.
- SPC focuses on the reduction of process variation. By identifying and addressing sources of variation, SPC helps in making processes more stable and predictable. That ultimately improved process performance and customer satisfaction.
- SPC helps organizations achieve cost savings by reducing waste, rework, and scrap. By minimizing process variations, SPC helps lower the cost associated with poor quality such as warranty claims, customer returns, and product recalls.
Conclusion
The 5 core tools of quality (APQP, PPAP, MSA, FMEA, SPC) plays a very important role in ensuring product excellence and customer satisfaction. Each of these tools has its unique power to identify, prevent and eliminate potential defects in the product.
You must learn these tools and start implementing them in your organization. Effective implementation of these tools will definitely change the way your organization operates and delivers products/services to the customers.
These tools have the ability to provide a powerful framework to organizations achieve operational excellence. Throughout this article, I have discussed these 5 core tools of quality management in detail including their benefits & practical applications. I hope you got it now.
If you found this article useful then please share it in your network and subscribe to get more such articles every week.


Pingback: Control Charts in Quality Control: 9 Charts You Must Know
Pingback: 5 Types of Inspection in Quality Control: A Comprehensive Guide