
SIPOC diagram is a powerful Six Sigma tool that is used to see business processes visually. It shows the entire process visually in such a way that the six sigma project team easily understands the entire process. This tool documents the entire process visually from beginning to end.
SIPOC diagram is used by the Six Sigma project team during the Define phase of DMAIC Six Sigma methodology in order to identify all the important elements of process improvement projects before the improvement work begins.
It is similar to a process mapping tool but does not provide much detail about the process. That’s why it is also called a high-level process map. In this article, we are going to understand the SIPOC diagram tool in detail with the help of an example.
The basic meaning of this diagram and How to construct this diagram? in the end, you will get in-depth clarity on this tool. So let’s start…
What is the SIPOC diagram?
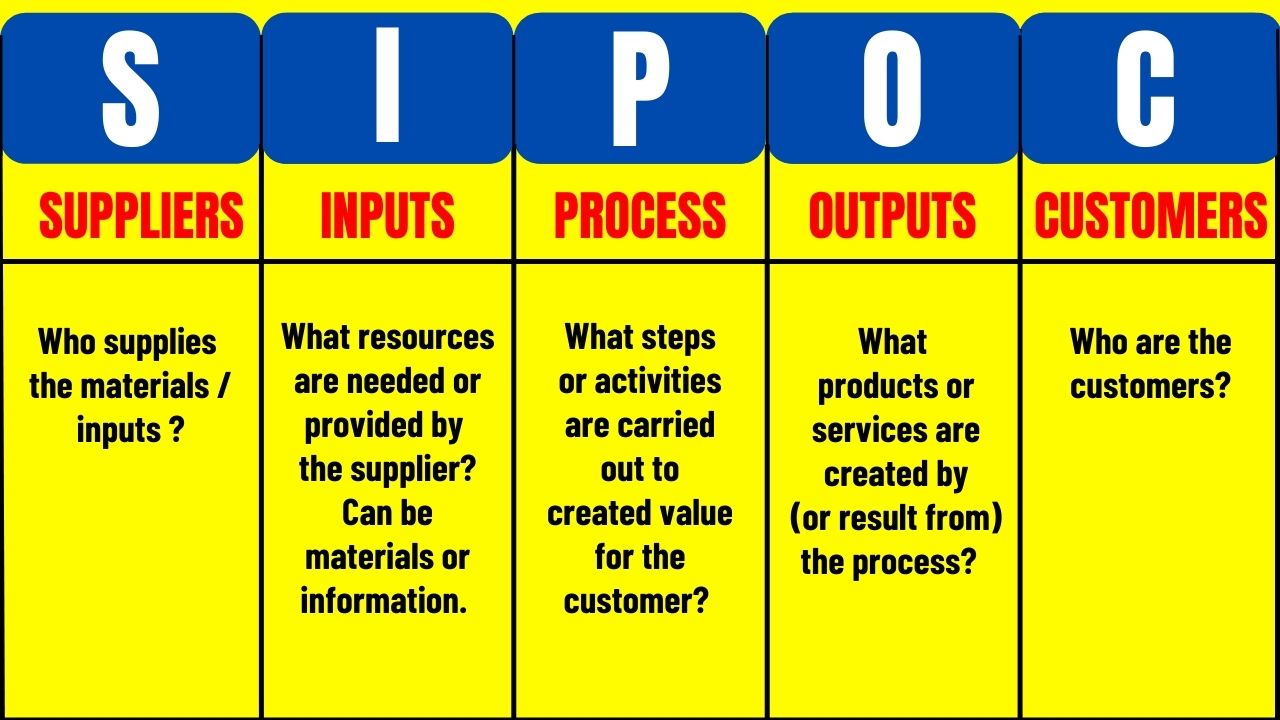
The SIPOC diagram is a visual process mapping tool also called a high-level process map. SIPOC stands for Suppliers, Inputs, Processes, Outputs, and Customers.
In 1980, this term first originated as a part of total quality management, due to its applicability in problem-solving work now this powerful tool has become the part of Lean Six Sigma methodology.
- Suppliers – Provide input into a process.
- Inputs – What goes into the process? (Resources like raw materials)
- Process – Steps that convert inputs into the final outputs.
- Outputs – End product or service that comes out of the process.
- Customers – Who receives the final process outputs?
This tool is useful to gather all the team members and leadership on the same page to understand the customer requirements and the business process for continuous improvement. It helps the team to better see and understand all the important factors that affect the process behavior and overall performance of the process.
This diagram has a lot of applications but the most popular one is in the problem-solving and process improvement work. As we know SIPOC diagram provides a high-level overview of the process, it can be used to explain any business process to the people as well as helps to identify problematic areas in the process.
This tool not just identifies the problem areas but also helps them isolate from the process. Also helpful when the team is not clear about certain information in the process, so it forces the team members to identify that information and add it to the diagram like Supplier details, target customers, service or product specifications, etc.
Benefits of this tool –
- It enables all the team members and leadership to view the process on the same page.
- It helps in Identifying the key inputs and outputs in the process.
- It provides a visual overview of the project to the stakeholders.
- It helps in Identifying problematic gaps in the process like input that the process doesn’t need but still, it receives, Process steps that are completed but do not add value, etc.
- It helps during problem-solving and process improvement initiatives.
- It is useful for training purposes (In order to train new employees about the process).
How to construct the SIPOC diagram?
In order to construct this diagram, the project team needs to focus on collecting all the important information related to 5 key elements of the SIPOC diagram i.e. Suppliers, Inputs, Processes, Outputs, and Customers.
The main purpose of creating this diagram is to present process information in the simplest way possible. To construct this diagram, you need to start with the table of 5 columns. Let’s see the step-by-step process –
1. Start by outlining the process –
The process is a structured step used to convert inputs into outputs. This diagram list down the 4 to 5 high-level process steps that consist of actions and subjects. While constructing the SIPOC diagram, process-level information is outlined in the middle column.
Initially, you need to finalize the process that you want to analyze. Then write down the name of the process in the respective column of the diagram, along with a detailed description of key process steps.
You can write the name of the process steps or you can draw a flowchart using the flowcharting symbol to make it easy to understand. This gives a high-level overview of a business process that you want to analyze.
While outlining the process, make sure you should not include more details because the SIPOC diagram is a high-level process map. Its purpose is to give a high-level overview of the process that you want to analyze.
Also, you should know the starting and ending points of the process that you want to analyze which will give more clarity to the diagram. Otherwise, if you are unaware of it then that will completely disturb the entire diagram.
2. Identify the outputs of the process –
The output of your process is the end product or service which you will deliver to the customers and it reflects the value required by the customers. While constructing the SIPOC diagram, all the output-related information is added in the 4th column next to the middle column.
In this step, you should focus on the key outputs of the process. Write down the 3 to 4 main outputs that you will get at the end of the process like material, information, products, service, etc.
Here you need to only list down the key outputs of your process, you don’t need to categorize them into good outputs or bad outputs.
3. Identify the final customers –
Customers are the end-user of products or services who will be going to pay the company for their offering. Customers can be external or internal to the organization.
Internal customer means stakeholders, coworkers, board members, etc. while external customers means the customers who actually benefit from the process outputs.
In this step of the SIPOC diagram, the team needs to list down all the internal and external customers in the 5th column of the diagram. Customer requirements are also listed in the last column.
In order to list down this information, the team can consider the criteria like who will get benefit from the process and who would be unhappy if the process is unable to meet requirements.
4. Identify the inputs for the process –
Inputs are the raw material, equipment, data, and other resources that are used to complete the process or produce final outputs. These inputs are provided by the suppliers. In the 2nd column next to suppliers these inputs are listed.
In this step of the SIPOC diagram, the team needs to list down all the important inputs, don’t need to list down every single one, just focus on listing the 5 to 6 inputs that are most significant.
5. Identify the suppliers for the process –
Suppliers provide the necessary inputs to the process. They can be internal or external to the organization. Information related to suppliers must be listed in the 1st column of the SIPOC diagram.
In this step of the SIPOC diagram, the team needs to write down all the suppliers for each input that have a direct impact on the process outputs. (Check out – SIPOC diagram templates)
That’s how you need to create the SIPOC diagram, it starts by listing the information of the process steps first. Then list down the final process outputs. After that list down the customers (internal or external) along with their requirements.
Then list down all the inputs required for the process and finally in the 1st column list down the suppliers who provide the inputs to the process. That’s how you need to follow the flow to create the SIPOC diagram.
Once this diagram is complete by adding all the important information. Then it is verified by the project leaders and stakeholders before its use in the project.
This powerful process improvement tool is useful in any industry or department like manufacturing, services, banking, tech company, construction, etc. to see processes visually.
SIPOC diagram example –
Until now we discussed the conceptual part of the SIPOC diagram, now let’s try to understand the application of this tool using 2 examples. These examples will provide you with a clear-cut idea of how useful this tool is.
Example-1: SIPOC diagram for the car purchase process.
| Suppliers | Inputs | Process | Outputs | Customers |
| Different car dealers | Quotation or details of car pricing | Quotation of respective car models | After-sales service contract | Car reseller |
| Car companies | Information on different car models | Perform test drive of selected car model | All the important documentation or paperwork | Individual car buyers |
| Individual car modifier | Details of car features and specifications | Shortlist the model and final purchase | Finally selected car | Different companies |
Example-2: SIPOC diagram for the coffee-making process.
| Suppliers | Inputs | Process | Outputs | Customers |
| Near daily needs shop | Water | Boil water | Cup of coffee | Family members |
| D-mart | Cup & Kettle | Add coffee to the cup | Friends | |
| Coffee | Add boiling water and milk to the cup | Guests | ||
| Milk | Serve the final coffee |
How does this tool help during the Six Sigma project?
- A SIPOC diagram is generally useful during the define phase of the DMAIC Six Sigma project to provide a visual representation of the business process.
- This tool provides a complete overview of the inputs and outputs of the process along with significant information about customers and suppliers.
- As we know the purpose of the Six Sigma methodology is to identify and remove the root cause of defects and reduce the variability in the process.
- SIPOC diagram supports the purpose of the Six Sigma methodology because, with the help of a visual overview of the process, project teams can better understand the process.
- They can visually see how different factors impact the process outputs. This information will help them to take action in the right direction in order to reduce the variation and defects in the process.
- In a nutshell, When you have the SIPOC diagram in hand during the project and if something goes wrong in the process you will have a clear picture of what needs to be done to get the process back on track. (Check out – What is DMAIC methodology?)
Conclusion –
SIPOC diagram is one of the easy-to-handle tools used during improvement projects but at the same time, it provides significant insights of the process in the visual format.
In this article, I discussed this tool in detail like its fundamental concepts, how to create the SIPOC diagram with the help of two real-life examples, etc.
I hope you understood this most trusted way of process mapping which provides an overview of the process in easy to understanding format.
If you found this article useful then please share it in your network and subscribe to get more such articles weekly.

Pingback: What is a process mapping in Six Sigma? Complete guide for 2022
Pingback: What is DMAIC process? 5 steps process improvement methodology
Good info