

Have you ever wanted to get to the real cause of the problem or an issue that you are facing in your business or Six Sigma projects? the best way to do that is an apply a fishbone diagram. This is one of the best problem-solving tools used in the Six Sigma project.
This tool was a part of TQM and was also used in the Toyota production system for problem-solving. It is really a great way to find the potential causes behind an issue or problem that might be happening in the business processes. It helps you visually recognize the cause & effect relationship between problems and processes.
In this article, I will discuss the fishbone diagram in detail like the history & structure of this tool, 6 categories of potential causes in the cause & effect diagram, and how to create a fishbone diagram step by step with the help of one practical example.
In the end, you will get complete clarity on how to use this tool for the identification of potential causes of the problem. This going to be a completely practical and example-based discussion. So let’s start…
What is a fishbone diagram?
In 1960, a Japanese professor who later become a quality guru invented the Ishikawa diagram which was used to measure quality control processes in the shipbuilding industry.
Later it becomes popular in problem-solving work by the name of the Ishikawa diagram as well as the cause & effect diagram.
Its main purpose is to identify the potential root causes of problems. It is also called a cause & effect diagram because it shows the cause & effect relationship visually which helps the project team easily identify the potential causes of the problem.
Because of its applicability in quality problem solving, it was also added to the list of 7 quality control tools. This diagram is used in different types of industries for new product design, quality defect prevention, improvement projects, etc.
The best thing about this diagram is it helps the project team visually display all the potential causes of the problem and then break down these causes in more detailed information until the link between the root cause and the problem is not found. We will understand how this happens later in this article.
This tool is useful during the analyze phase of the Six Sigma project. In the Six Sigma DMAIC process improvement cycle, the analysis phase brings together all the information collected, defined, and measured including the overall project goal, information from the process mapping, measured data, etc.
This information is then use to start the root cause analysis of the problem. In the analysis step, the cause & effect diagram is the first level of dissecting the process to discover the root causes.
This tool helps the project team think together on paper and helps them get things down on post-it notes on flip charts, helps them start to discuss, and starts to discover connections or things about the problem they have not thought of before.
The fishbone diagram systematically identifies all the sources that might contribute to the undesirable symptoms under investigation and it’s generally done in a brainstorming session among a team of people who are knowledgeable in the problem area.
Relevant content – What is DMAIC methdology?
Get certified in Lean Six Sigma –EALSS Academy
Structure of fishbone diagram-
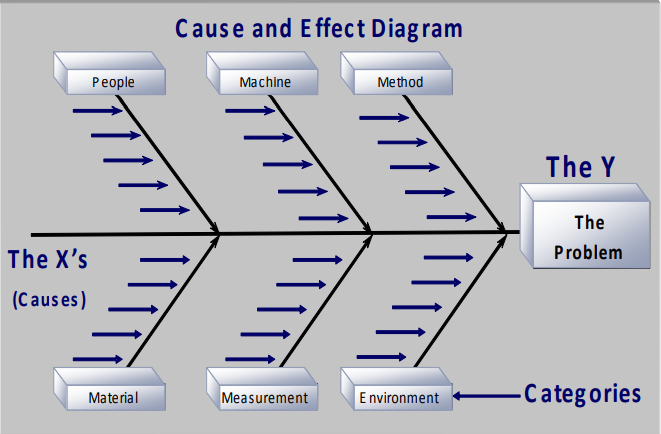
The Fishbone diagram as the name suggests fish + bone, it represents the fish skeleton. On the right-hand side, the problem is placed as a fish head and all the potential causes are extended to the left as the bones of a fish skeleton.
Fishbone is connecting the fish spine (central line) to the 6 different categories of potential causes. The central single line extends to the left (fish spine), connecting the problem (fish head) to the rest of the diagram. (includes potential causes (fish bones) and 6 categories.)

The cause and effect diagram not only helps in the investigation of the potential causes but also serves as a means of recording the entire problem-solving process.
In this diagram, the potential causes should be investigated and recorded under some major categories. These categories are different for manufacturing and service industries.
In the case of the manufacturing industry, the process is mostly dealing with the physical product so the categories for potential causes are Machine, Manpower, Mother Nature, Measurement, Method, and Material. In the product-based process, the root causes of the problem generally belong to these 6M categories.
In the case of transactional or service-based processes in which the output is not a physical product and the process is dealing with ideas, people, services, and decisions, the categories for potential causes of the problem are People, Policy, Procedure, Place, Measurement, and Mother nature.
That means, for example, if you are determining the root causes for burnt pizza (physical product) then use 6M categories and if you are trying to reduce order defects from the order-taking process then use transactional process categories.
While creating a cause & effect diagram, the potential causes are distributed or identified by considering these categories as per the type of process i.e. manufacturing process or service process.
To identify these exact root causes, keep drilling down as a team you should always ask “why” until you find the root cause of the problem. Start with one category and stay with it until you have exhausted all the possible inputs and then move to the next category.
You will understand this once I will start a discussion on how to create a fishbone diagram later in this article for now let’s see those 6M categories in detail because 6M is the starting point of creating a cause-and-effect diagram.
Measurement –
Measurement category groups root causes related to the manual/automatic measurement, physical measurement, and measuring of a process activity or output. Here you can ask the following questions to identify root causes in this category. –
- Is there a metric issue?
- Is there a valid measurement system?
- Is the data generated or collected good enough?
- Is the data readily available?
Manpower –
The manpower category groups root causes related to people who are working close to the process or on product, staffing, and organizations. Here you can ask the following questions to identify root causes in this category. –
- Are people trained, do they have the right skills?
- Is there person-to-person variation in the measurement data?
- Are people overworked?
Method –
The method category groups root causes related to how the process is done, and the way the process is actually conducted. Sometimes too many steps in the process create problems in the process. Here you can ask the following questions to identify root causes in this category. –
- How is this method performed in the process?
- Are the procedures that we are following in the process correct?
- Does the process streamline or standardized?
Material –
The material category groups root causes related to raw materials, parts, supplies, forms, or information needed to execute the process. Here you can ask the following questions to identify root causes in this category. –
- Are bills of material correct?
- Are parts or supplies obsolete?
- Are there defects in the materials?
- Is the material incorrectly specified, mislabeled, or stored improperly?
Machine –
The Machine category groups root causes related to the systems, tools, facilities, and equipment used in the process. Here you can ask the following questions to identify root causes in this category. –
- Have machines been serviced recently, what is the uptime?
- Have tools been properly maintained?
- Is there variation in the process due to machines?
Mother nature –
The mother nature (environment)category groups root causes related to our work environment, market conditions, and regulatory issues. Here you can ask the following questions to identify root causes in this category. –
- Is the workplace safe and comfortable?
- Are outside regulations impacting the business?
- Does the company culture aid the process?
So these are the 6 important categories of causes of problems you need to consider while creating a fishbone diagram and with the help of those questions of the respective category you can identify the potential causes of the problem.
You can apply the same logic in the case of a transactional process to identify potential causes of problems. Now let’s see how to create this diagram step by step –
How to create a fishbone diagram?
The Fishbone diagram pushes you to consider every possible cause of the problem with the help of brainstorming instead of getting stuck. It not only helps you figure out root causes but also helps you uncover the bottleneck in the process and specific areas where your process is not working effectively.
Now let’s understand how to create a fishbone diagram step by step –
1. Identify and define the problem –
The 1st key step in solving a problem using a cause-and-effect diagram is to correctly identify and define the problem. What exactly the problem is? who is involved there? when and where that problem occurs?
When the problem is defined clearly, it is easier to identify the potential causes that affect the process or product. It also encourages evaluating the data to understand whether there is a problem or not.
After that, if you are using sheet paper for creating a diagram then write down the problem on the right-hand side of the sheet paper i.e. fish head, and then draw a horizontal line from the fish head across the paper that is nothing but the fish spine.
So this foundational arrangement of fish head and fish spine gives you space to develop ideas or causes that contribute to the problem.
2. Identify major categories of causes of the problem –
Once you defined the problem properly the next step is to identify major categories of causes of the problem. Figure out which areas of the problem or process are important to find the actual cause. Depending upon the type of process you can identify the major categories of the causes.
As I shared earlier, for product-based processes the categories of causes are Manpower, Machine, Method, Material, Mother Nature, Measurement, etc (6M). And for service-based processes, the categories are People, Procedure, Policy, Place, Measurement, Mother Nature, etc.
Also, one more approach used in the service industry for categories of potential causes is called 4S i.e. Surrounding, Suppliers, Systems, and skills. For a service-based process, you can use either the 4S approach or the earlier one.
On the other hand, If you are applying a fishbone diagram in product marketing then the categories of the causes are Product, Price, Promotion, Place, Process, People, Performance, Physical evidence, etc. these are called the 8Ps.
In this step, you should write down the categories of causes (as per the type of process 6M, 4S, 8P) on the upper and lower side of the fish spine (center horizontal line) and then join the fish spine to these categories using straight lines called fish bones.
3. Identify potential causes of the problem –
Now at this step, you have the basic structure of the fishbone diagram ready i.e. fish head (problem) on the right side and the center horizontal line (fish spine) connected to the fish head, and then all the categories of causes connected to the center line using fish bones.
For each category, brainstorm the possible causes of the problem and for the brainstorming session invite other team members who are working close to the process or product to ensure all the potential causes are identified.
Write all the potential causes of the respective category and also create sub-branches of fish bones because some potential causes may have multiple sub-causes.
Here your focus should be on identifying as many causes as possible for each category by using tools like brainstorming.
4. Ask ‘why’ for each potential cause –
At this stage, your fishbone diagram is ready with displaying all the potential causes of the problem. Now here, you need to dig into the depth of potential causes identified because the initial causes you identified are like symptoms of the problem.
So, you need to ask ‘why’ for each potential cause to get the actual root cause, and for that, you can use tools like 5 why analysis during a brainstorming session. In the 5 why analysis, you should find out why does this happen? for each cause, ask ‘why’ multiple times.
Continue to ask why multiple times to generate a deeper level of causes and simultaneously write those under the respective categories of causes. This step will help you get closer to the actual root causes of the problem so that you can prevent future problems.
5. Analyze the diagram and investigate as well as evaluate the correct causes –
Once you brainstorm all the root causes, in the last step you need to evaluate those causes whether those causes actually impact the output or contribute to the problem.
For that, you need to use team tools like the nominal group technique or multi-voting where you can rank all the causes according to their impact on the problem. Then determine which root causes are controllable and which are uncontrollable.
So by understanding which root causes are affecting your process or contributing to the problem, you can create an action plan to further investigate those causes and prevent them from occurring again.
These are the 5 steps that you can follow to create a fishbone diagram to solve any complex problem at your workplace and make sure you should involve knowledgeable team members in this activity to get the best results in the end.
Now let’s see one simple example of a cause-and-effect diagram.
Example of fishbone diagram –
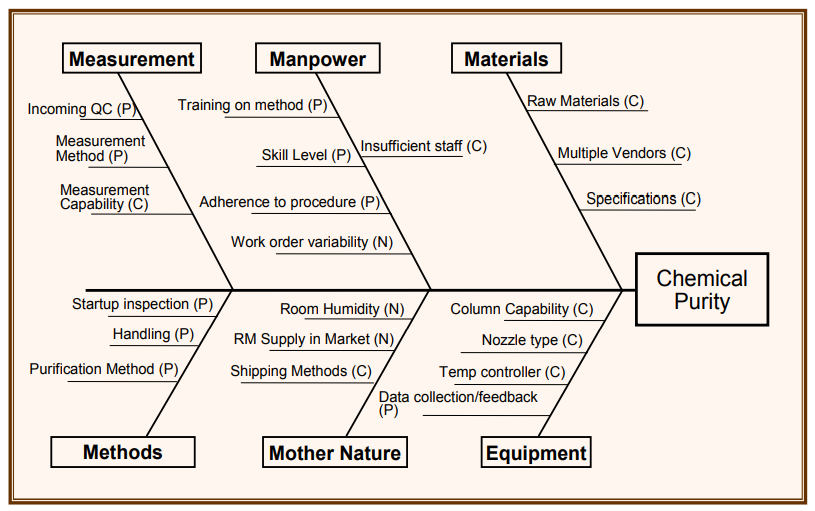
This example of a cause and effect diagram is of a problem called chemical purity (Y variable or effect which is written on the right side of the diagram i.e. Fish head).
The potential causes of the problem are written on the left side these causes are divided into 6M categories as this is a product-based process (Physical output). (Check out – the Fishbone diagram template)
Problem or cause (Fish head) – Chemical purity. You can see the categories in the diagram showing respective potential causes. Eg: Material – from the material category the causes of chemical purity are raw material, multiple vendors, and specifications.
You can see that C, N, and P are written in brackets in front of each cause in the diagram. C means controllable causes, N means noise or uncontrollable causes and P means procedural or causes related to people and systems.
Advantages & Disadvantages –
Advantages:
- The biggest advantage is it helps to identify cause-and-effect relationships with underlying problems.
- It promotes brainstorming discussion among team members which encourages broad thinking so that team members can think beyond limitations without getting stuck.
- It helps to categorize all the potential causes into 6 important categories (6M) so that team members can easily figure out the problematic area in the process.
- It uses tools like 5 why analysis during the brainstorming session which helps the project team drill down to one or more root causes of the problem and get more details.
Disadvantages:
- Sometimes brainstorming sessions produce some irrelevant potential causes along with the relevant and this makes confusion as well as waste time while selecting the real potential causes for problem-solving.
- Sometimes because of multiple categories (6M), it becomes difficult to display all the potential causes in a fishbone diagram.
- During brainstorming sessions, if the project team identifies more number of potential causes of the problem then sometimes this may create confusion amongst the team member that this problem is too big and difficult to solve.
Useful tips for creating a fishbone diagram –
- Make sure your team is effective – While creating a diagram, make sure that your team members are from multiple areas or they are directly working close to the process where the problem occurred so that your team members can provide valuable insights about the problem.
- Use team decision-making techniques – To identify the potential causes of problems with full consensus of team members without any conflict then you should consider the use of tools like brainstorming, Nominal group technique, and Multi voting. (Check out – Top 5 group decision-making tools)
- Clarify the 6M categories of potential causes – As per the type of process (Product based process or service-based process) clarify the categories of potential causes. This must be your starting poting while creating a diagram because it gives you the direction to identify the root causes of the problem in detail.
- Use 5 why analysis – While analyzing a fishbone diagram you must use 5 why analysis because this single tool provides you with the exact potential causes of the problem. Asking ‘why’ multiple times can help you get to the root causes of the problem quickly.
- Consider other root cause analysis techniques – If your problem is more complex and it is difficult to identify the root causes using a fishbone diagram then you can also think about other root cause analysis tools like Pareto chart, fault tree analysis, FMEA, Scatter plot diagram, etc.
Conclusion –
The fishbone diagram is a visual representation of cause-and-effect relationships. It is a composition of simple lines and words representing a meaningful relationship between the effect (problem) and its causes.
It can effectively be used in improving processes and the quality of products or services. Organizations can use this reactive tool to solve problems quickly and accurately by identifying the right potential causes of problems.
Six Sigma project teams can use this tool to achieve six sigma level performances in the process. In this article, I discussed the fishbone diagram in detail, I hope you understand how this tool can help you identify the root causes of the problem.
If you found this article useful then please share it in your network and subscribe to get more such articles.


Pingback: What is COPQ (Cost of Poor Quality)? Complete Guide for 2023
Pingback: DMAIC vs DMADV: Which Methodology Is Right For You?
Pingback: 7 Management and Planning Tools You Must Know