

Bottleneck analysis is one of the key concepts in Lean manufacturing. An identifying bottleneck in the process is essential because it leads to an increase in waiting time in different process steps, loss of customers, and also loss in the company revenue.
A single bottleneck in the process can become responsible for the production of poor-quality products. That’s the reason figuring out and fixing them is most important in order to maintain the continuous flow of the process.
In this article, we are going to understand what is bottleneck analysis in detail along with its types and benefits. We also going to understand how to conduct this analysis using one case study example. In the end, you can be able to perform this type of analysis for your process. Now let’s start…
What is the bottleneck?
The bottleneck is any constraint in the process that limits the ability of a process to produce goods at a regular rate. It is the point in the assembly line or production system that occurs when the workload arrives too quickly for the manufacturing process to handle.
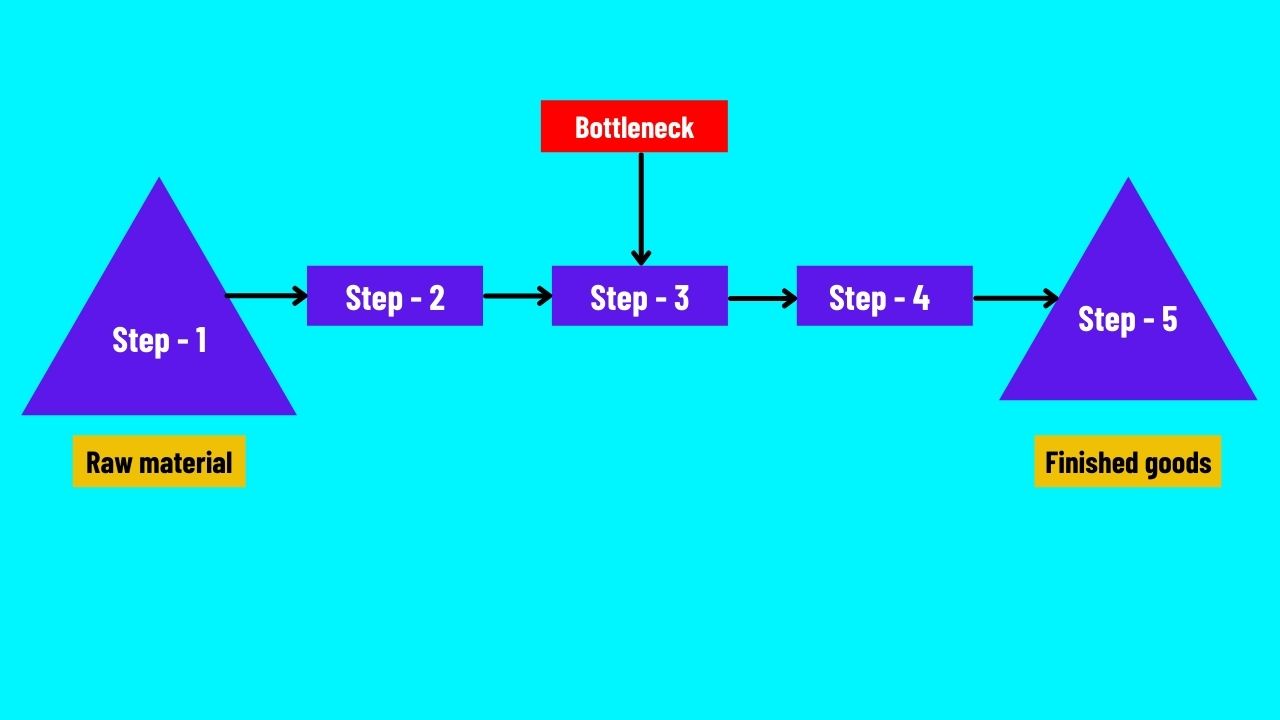
It can have a massive impact on the entire flow of the assembly line or process and also increases the time and cost of manufacturing. Let’s understand this with a simple example, suppose we have 5 step production process from raw material to process steps 2, 3, and 4 and in the end, the last step is finished goods.
Let’s say material enters into the process as a first step, and then from process steps 2 to 4 our resources or activities that are being performed to transform the input raw material into the output final product. And if process step 3 is working slower than the other processes then that is nothing but the bottleneck in the process.
This slow 3rd process step limits the ability to produce the final product at a regular rate. Hence process step 3 is the bottleneck of the entire process. In order to improve the efficiency within any process and operate that process in a consistent manner, this type of bottleneck must be fixed.
To fix that we have to conduct bottleneck analysis, which helps in understanding the root cause of bottlenecks in the process, how to find them and fix them, also prevent them from occurring in the future.
Generally, there are two causes of bottleneck because of which it occurs i.e. bottleneck caused by process steps and bottleneck caused by people.
When one process step is operating at a faster rate than the other or slower rate than the other then this type of bottleneck is caused by process steps in the line.
Similarly, the overall operating speed of the process gets reduced because of a lack of effective training for employees and operators who are working close to the process, this type of bottleneck is caused by the people. Before conducting bottleneck analysis you need to be aware of these two important causes.
Bottleneck creates a problem in the entire workflow, major interruptions to work productivity, delays the production process steps, and also affects the takt time that because of a single bottleneck the entire process fails to keep up with the rate of customer demand.
Types of a bottleneck-
You need to also understand the two important types of bottlenecks because depending upon their occurrence, you have to take further action to fix them i.e. Short term bottleneck and Long term bottleneck. You can fix short-term bottlenecks easily but to fix long-term bottlenecks you need to investigate the entire process.
- Short-term bottleneck – These types of bottlenecks are caused by temporary problems and they remain for a short-term period. For example – skilled operators are not available for a few days, interruption in the supply chain due to limited staff, etc.
- Long-term bottleneck – These types of bottlenecks are reoccurring and remain there for a long period of time. It impacts the entire process, production line, and capacity, which results in a loss in revenue. They are considered major bottlenecks that need to be investigated by using lean tools.
- For example – No real-time data is available to identify production patterns, disorganized workforce, and inventory systems, a lack of useful technologies at the workplace, and Exhaustive work instructions, and audit procedures.
Short-term bottlenecks do not need regular attention or solution but long-term bottlenecks need investigation and solutions for their root causes.
What is bottleneck analysis?
Bottleneck analysis is the method of identifying the bottleneck in the process, where the actual problem in the process is occurring. Because of this, the entire process takes more time as compared to the expected time to finish the work.
Bottleneck analysis helps in identifying which areas of the process or process steps are causing the delay and slowing down the process as compared to the expected rate. This tool can identify these issues and fix them.
Instead of finding out the symptoms, this tool finds out the exact root cause and helps us understand where the actual bottleneck is occurring. For this, it requires root cause analysis tools like 5-WHY analysis and fishbone diagram, etc.
5 Why analysis can identify events that lead to bottlenecks in the production. This tool figures out the exact reason that causes a bottleneck by asking a sequence of Why questions at least 5 times.
Similarly, a fishbone diagram can also help you visually show the potential causes of bottlenecks that are occurring in the process. Along with these tools, the theory of constraint is one more powerful method that helps in identifying the bottleneck in the process.
TOC is a methodology of identifying the most limiting factor or constraint or bottleneck in the process that stands in the way of achieving the end process goal and then removing them systematically from the process.
These three powerful bottleneck analysis tools can help you in finding out the root causes of a bottleneck, that is occurring in the process and disturbing the entire workflow.
Read more – What the 7 quality control tools? understand with examples
Benefits of bottleneck analysis –
- Bottleneck analysis helps minimize poor-quality products, increasing worker efficiency, and reducing downtime.
- It helps in exploring the possible solutions to address the bottlenecks in the process and helps in increasing overall production capacity while reducing lead time.
- Bottleneck analysis also helps in eliminating waste in the process. Because bottleneck generally occurs in inefficient processes, which results in different types of waste in the process. So when you remove the bottleneck from the process you automatically eliminate the waste.
- It streamlines the process because after removing the bottleneck your process starts working efficiently and maintaining the continuous flow.
- It helps in reducing inventory in between the process steps and makes the process flow smoothly.
- The entire process of bottleneck analysis helps in increasing the knowledge of that process and workflows so that in the future organizations can make information-based decisions that may stop the bottleneck from occurring.
How to deal with bottlenecks in the process?
Process bottlenecks are some of the big reasons why improvement projects get delayed. It will increase the cost of projects and that’s the reason the project team should perform bottleneck analysis and prevent this issue from occurring in the future.
Along with identifying where bottleneck forms, this analysis also helps in identifying potential solutions to deal with bottlenecks. Let’s see some of the standard ways organizations use to deal with bottlenecks in the workflow.
- Increase additional capacity – If the bottleneck is caused at a particular process step in the production process, then you can think about increasing the additional capacity. For example – if a bottleneck occurs during the painting process step of the car manufacturing process then you can add one more painting step in the process. These two painting stations can double the capacity and eliminate the bottleneck in the car manufacturing process.
- Eliminate the non-value-added steps – There are some process steps which are not add any value to the product, but only add waste to the end product. You have to find out such process steps and remove them from the process because these non-value-added steps create waste in the process. Eliminating the waste can help you remove the bottleneck in the process.
- Add additional workforce – An insufficient workforce to complete the work is also an important cause of a bottleneck in the process. Adding additional workforce at a specific process step is useful to maintain a smooth process flow and remove the bottleneck from the process.
- Adjust the workflow – When a bottleneck forms in any process step, you can think about skipping and finishing that process step later. This is useful to deal with short-term bottlenecks like problems in the particular machine or if an operator is not available for a few days. etc.
- Balance the production line – It is often possible that production lines are not properly balanced, which means some process steps are more overloaded and some are less overloaded. This may create a bottleneck in the process so balancing the entire workflow is essential to prevent the occurrence of bottlenecks.
- Train the employees/operators – It is important to work on bottlenecks when they occur in the process before it becomes a serious problem. But it is even more important to avoid bottlenecks occurring and for that, it is important to train employees/operators to consistently watch out processes and detect the signs of bottlenecks or problems as early as possible.
Read more – What is Line balancing and how to achieve it?
Bottleneck analysis example –
Here we are going to understand the bottleneck analysis step by step using the T-shirt production example. The T-shirt production line consists of 3 process steps i.e. Raw material, Inserting, Cutting, Sew, Finished goods, etc. Let’s find out the bottleneck in this entire process of T-shirt production.
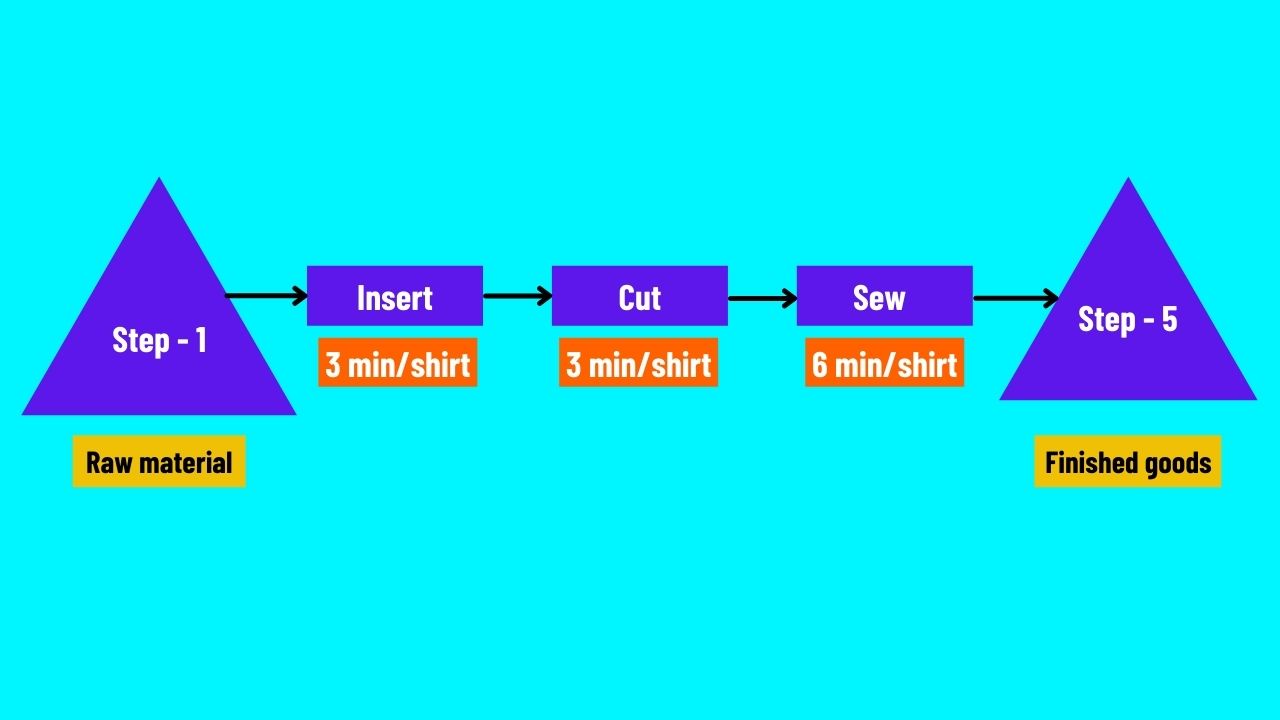
The First process step is the raw material for T-shirts i.e. different color fabrics, then that raw material is inserted through process step 2 i.e. Insert – after this material enters into process step 3 i.e. cutting (textile cutting machine).
Then at this step material cuts as per patterns and then sewn together at process step 4 i.e. sew. In the end, the finished goods will be ready, i.e. T-shirt.
There are 3 major process steps in the T-shirt production line i.e. Insert, cut, and sew. Each has a specific process time i.e. Insert – 3min/shirt, Cut – 3min/shirt, Sew – 6min/shirt. Let’s find out the bottleneck in the process.
Step 1:- Calculate overall process time – (units/min)
Let’s understand the 3 important terms i.e. Flow unit, Flow time, and Process time. The Flow unit is a final product that flows through the process (T-shirt).
The Flow time is the time needed to process one flow unit through the process. Process time is the time it takes for an activity to process one flow unit.
The Flow unit for this example is one T-shirt, how long does one T-shirt take to move through the entire process? at first step 3min, 2nd step is 3min and 3rd step is 6min so overall process time = 3 min + 3 min + 6 min = 12 min/shirt.
Step 2:- Process capacity calculation – (units/hr)
2nd step of bottleneck analysis is to calculate the process capacity for each process step separately. What is the capacity of 1st process step? i.e. Inserting. We know the processing time for this process is 3 min/shirt.
In order to calculate process capacity, we need to understand the concept of resource capacity. Resource capacity is the maximum number of flow units that an activity can process per unit of time.
Resource capacity = 1/processing time = 1/p
For the insert process step, the processing time is 3 min/shirt which means resource capacity is 1/p i.e. 1/3 min/shirt. We can say it as 1 shirt per 3-minute pass through this process step.
If 1 shirt = 3 min then how many T-shirts can be processed within 60 min (1hr)? So 1 shirt = 3min then X units = 60 min, X = 20 shirts/ hr. Hence the process capacity of the insert process step is 20 shirts/hr.
For the cutting process step, the processing time is again 3 min/shirt which means resource capacity is 1/p i.e. 1/3 min/shirt. We can say it as 1 shirt per 3-minute pass through this process step.
If 1 shirt = 3 min then how many T-shirts can be processed within 60 min(1hr)? So 1 shirt = 3 min, then X units = 60 min, X = 20 shirts/hr. Hence the process capacity of the Cutting process step is 20 shirts/hr.
For the sewing process step, the processing time is 6 min/shirt which means resource capacity is 1/p i.e. 1/6 min/shirt. We can say it as 1 shirt per 6-minute pass through this process step.
If 1 shirt = 6 min then how many T-shirts can be processed within 60 min(1hr)? So 1 shirt = 6 min, then X units = 60 min, X = 10 shirts/hr. Hence the process capacity of the sewing process step is 10 shirts/hr.
Step 3:- Compare the process capacity of each process step –
Now we calculated the process capacity of each process step. i.e. Insert = 20 shirts/hr, Cut = 20 shirts/hr, Sew = 10 shirts/hr. After comparing the process capacity of each process step, the lower capacity found at the sewing process step i.e. 10 shirts/hr. Hence it shows the bottleneck in the T-shirt production line.
The process step which has the longest process time (6 min/shirt) and lowest resource capacity (10 shirts/hr) is the bottleneck in the T-shirt production line. i.e. Sewing process step.
Step 4:- Bottleneck interpretation –
Overall process capacity is the minimum resource capacity process step in the T-shirt production process. We found the minimum resource capacity which is 10 shirts/hr i.e. Sewing process step. Hence the overall process capacity is also 10 shirts/hr.
The process step with the smallest resource capacity is called a bottleneck. We can also conclude that the overall process capacity of a T-shirt production line is equal to bottleneck process step capacity i.e. 10 shirts/hr.

Even the insert process step and cutting process step produce 20 shirts/hr, still, you are not allowed to produce partially finished T-shirts in between the process steps.
This entire T-shirt production line works at a rate of the bottleneck which is 10 shirts/hr. That’s how a bottleneck creates a problem in the process flow. It disturbs the entire process production rate.
Hence it is important to identify it through the bottleneck analysis method and fix it as early as possible. You can also think about the different ways to deal with bottlenecks that we discussed earlier.
Conclusion –
Bottleneck analysis is one of the most important lean tools that helps you identify the problematic areas in the process and also provides you with a clear picture of where you need to focus in the process to maintain the smooth flow of the process.
In this article, we discuss the concept of bottleneck analysis in detail like its meaning, benefits, and different ways to deal with bottlenecks. We also discussed how to conduct bottleneck analysis with the T-shirt production line example. With this much explanation, I hope you understand the concept.
If you found this article useful then please share it in your network and also subscribe to get more such knowledgeable articles.


Hi, Thank you for understanding the bottleneck concept. I found this article very interesting. Though one thing I want to know that, what is the difference between flow time and process time ?
Flow time = Processing time + any time unit spends between the steps. and process time – the only time that is required for inputs to be transformed into outputs.
Pingback: Kaizen Tools: 5 Tools You Must Know for Continuous Improvement
Pingback: 5 Whys Analysis Example: Identify Root Causes of Problems
Pingback: What is Lean in manufacturing? Complete guide for 2024