

The check sheet is one of the best tools used during the Six Sigma project. This tool helps the project team with data collection of any process easily. This tool is quite popularly used for problem-solving at organizations as well as for process improvement work because of its easy useability.
In this article, We are going to understand this powerful process data collection tool with one practical example. We will cover its conceptual meaning, benefits, and how it helps during problem-solving. With that practical example, I will show you how to make a check sheet and interpret its final result.
So this article is going to be a complete guide on this powerful quality control tool. Let’s begin…
What is a Check sheet?
The check sheet is one of the tools from 7 quality control tools used for problem-solving during the Six Sigma project. It is the graphical presentation of information, a data gathering, and interpretation tool which is also considered as the simplest way to assess common process problems.
The check sheet is used for collecting data in real-time and at the real location, where data is generated. This tool is pretty simple in design the reason behind its simplicity is that this is a data recording tool which is an easy task and 2nd reason is that it is most useful to those people who work on the shop floor or work very close to the process.
Those people need some simple and easy-to-handle tools to collect data that’s why it was designed simple. Right! This tool helps the process improvement team in distinguishing between actual facts and opinions and also gathers data about how often a problem occurs in the process and the type of that problem.
Data collected on the check sheet shows what happens on the shop floor or in the process over a period of time. That data is errors or defects which occurred in the process and that is recorded on a daily basis. This data from the check sheet is useful during the project team’s brainstorming session.
This check sheet is generally a blank form that is designed for the easy and effective recording of the required process information, it could be in the form of continuous or discrete data. That data can also be used as input data for creating other 7 qc tools.
Read more – What are the 7 quality control tools?
Generally, data is recorded by making simple marks or checks in the different regions of check sheets, which are then read by observing the problem location and number of marks on the sheet.
These check marks on the check sheet indicate how many times a particular value has occurred, which then helps you figure out the defects or errors within your process or products, sometimes even causes of defects.
Overall this tool provides the raw data to the team that helps the team discover the problem that they need to know about before solving them by performing the Six Sigma process improvement project. This tool is used for measured data during the measure phase of DMAIC.
Read more – What is DMAIC methodology?
I hope now you got the fundamental clarity about this tool. Now let’s have a look at Dr. Karu Ishikawa’s identified 5 important uses for check sheets in quality control. –
- To check the shape of the probability distribution of a process in the histogram.
- To quantify defects by type.
- To quantify defects by location.
- To quantify defects by cause.
- To keep the track of the completion of steps in a multistep procedure.
What are the types of check sheets?
Generally, there are four types of check sheets. It’s important for you to understand the use of each of those types so that you can select the right type according to the situation or problems you have. Let’s see those types one by one –
1. Defect type sheet –
This is one of the simplest types of sheets used to mark how many times a particular defect occurs i.e. occurrence of the defect and it allows the person to easily count those occurrences for later use.
During improvement projects, teams deal with defects in the processes, in order to remove those defects from the process initially, it is important to categorize them according to factors like the type of defect and its frequency of occurrence.
That is where this check sheet is useful, by using the defect data from this sheet project team can easily take an overview of the current state of defects in the process. This sheet helps in highlighting which type of defect occurs more frequently so that team can take further action accordingly.
2. Defect location sheet –
This type is also similar to the defect type sheet, but its focus is on tracking the locations of defects where they are occurring in the process. It can be a super powerful combination when defect location and defect type sheet are combined together.
Because that can help the project team to get the complete picture of the current process situation, defect type, and its location, means their combination gives a lot of useful information to the team with less effort and time.
3. Defect cause sheet –
The 3rd type of sheet tracks the data related to the causes of each defect in the process. Generally, this is useful when the project team running the root cause analysis means when they are interested in finding the actual root causes of defects occurring in the process.
This sheet is not commonly used, it depends on what the project team is looking for. The information collected from the defect cause sheet can be useful during process improvement projects. This sheet only provides the information related to the causes of the defect, it won’t help the team in correcting those causes.
4. Process probability distribution sheet –
This 4th sheet is used when the project team needs the visual picture of the probability distribution of collected data. Because this sheet provides a clear picture of how the collected data is distributed?
While working on this sheet project team has to set the appropriate upper and lower specification limits, which then allow the team to easily identify the outlier present in the collected data. Also helps in identifying the process area which needs more focus during the improvement project.
When to use check sheet?
- This tool is used when people who are working close to the process collect data manually.
- It is used when the data collection process is going on repetitively at the same location by the same operator.
- Useful when capturing frequency data in order to understand the pattern of defects, rejections, problems, and all types of issues in the process.
- Useful when there is a need to collect production data of different shifts, machines, and operators.
- Useful to capture important parameters related to products, services, and also the parameters related to the entire process in order to verify quality.
Benefits of this quality tool –
- Collect data in a systematic and organized manner.
- To determine the source of the problem.
- To facilitate the classification of data.
- Helps to provide input data to make a Bar graph, Pareto chart, and Histogram.
- Helps to make one-stop decisions to control non-compliance related to production and process.
Difference between Check sheet Vs Checklist –
People always get confused between checksheets and checklists. Let’s now remove this confusion permanently, as we already discussed what the check sheet is? It is the tool for data capturing and organizing that measured or counted data. This also provides input data to create a Pareto chart, Histogram, and Bar chart.
On the other hand, a Checklist is a list of important steps or action that needs to take, while checking process outputs or end results as well as performing process audits. It is used to make systematic checks of steps/actions or products to ensure that the worker or supervisor does not forget anything important.
In simple words, the Check sheet collects data and the checklist is a visual reminder to ensure all tasks need to be completed. The advantage of the checklist is that it enables supervisors/workers to systematize the repetitive activities and controls what workers have to do.
It is also used as a register of the tasks that workers have done each day. So overall this tool organizes the work effectively.
How to create a check sheet?
Before creating the check sheet you need to remember the three important points –
- It should be easy to use and understand.
- It should be displayed in a visible area so that everyone can easily access it.
- Describe clearly who will collect data? When will collect data be? Where will collect the data? How will data be collected?
Remember these 3 points and then start creating the sheet. The steps to create a sheet are simple by following these steps one can create a check sheet easily. The steps are as follows –
- Figure out what type of information you want to collect using the sheet, it could be defect data or problem data.
- Then you have to decide when you will be going to collect that data and for how much time. That means you have to establish data collection frequency.
- In the 3rd step create a sheet that generally includes 4 to 5 columns with heading like the title (defect type), time and date (when that data is captured), location (where that defect found in the process), operators name (who is responsible for data collection).
- You have to set up the sheet in such a way that all defect types data are recorded easily by simply making checkmarks.
- Then you have to test the sheet by conducting data collection trials for a short period, in order to ensure that sheet is easy to use and collect the required data.
- After the trial period if you get the approval to use that sheet then the next step is to train more operators on the usage of a sheet for data collection.
- After final approval and training, the sheet will be ready to collect data or we can say ready to use.
By following these steps and with the guidance of the team leader, you can make a check sheet for your data collection work. Hope you got the concept, now let’s understand it with the help of one example.
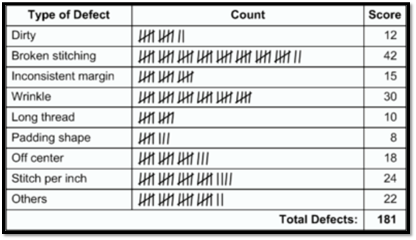
Example of check sheet –
This is the example of a defect type check sheet, you can see the basic structure of this sheet. Here the data related to different types of defects were recorded for 7 days. Also, all other details are given in the sheet which clears other important things.
You can see on the top side of the sheet important information is given like the name of the company, name of products and inspector (who recorded the data), also the information about measuring method, how many parts checked and how many are defective has given on the top side.
The most important information that when this data has been recorded? this information is also given that after the blasting stage inspector recorded this entire data for 7 days. These are the important things you can see on the top side of the sheet.
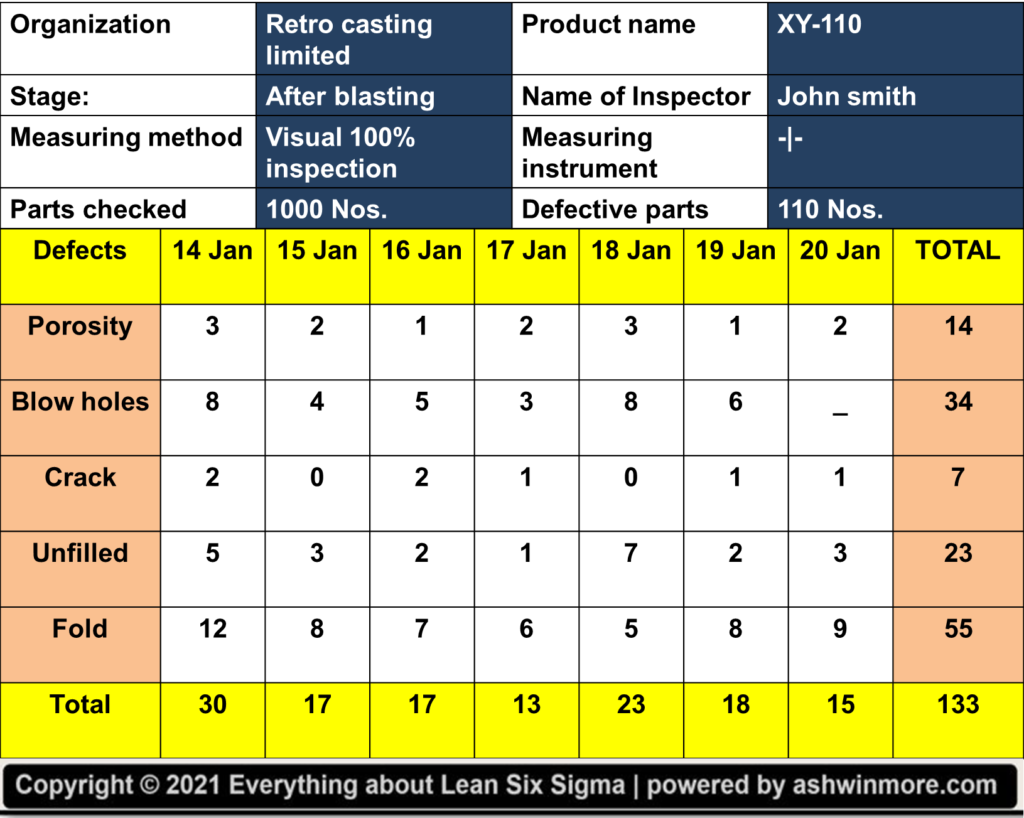
Then the first column consists of different types of defect names and in their respective rows inspector collected the data about how many times each type of defect occurred on each day and he recorded this for 7 days.
Let’s say the first defect is porosity on 14 Jan it occurred 3 times, on 15 Jan it occurred 2 times, on 16 Jan it occurred 1 time, on 17 Jan it occurred 2 times, on 18 Jan it occurred 3 times, on 19 Jan it occurred 1 time, on 20 Jan it occurred 2 times. Then similarly this occurrence data for each day was recorded for each defect type.
Total occurrence of defect type in 7 days recorded in the last column i.e. porosity occurred 14 times, Blowholes occurred 34 times, a crack occurred 7 times, Unfilled occurred 23 times, Fold occurred 55 times. Also on the bottom side, there is one more row of the total which shows how many defect types occurred per day?
That means on 14 Jan total number of defects occurred is 30, on 15 Jan total number of defects occurred is 17, on 16 Jan total number of defects occurred is 17, and like that. That’s how after the blasting stage, this type of important data has been recorded in the check sheet for continuous 7 days.
All this data has been recorded by checking 1000 parts out of which 110 parts are defective, this information is already mentioned on the top side of the sheet. The common observation from this sheet is listed here –
- The highest number of defect types that occurred is ‘Fold’ i.e. 55 times in 7 days.
- The lowest number of defect types that occurred is ‘Crack’ i.e. 7 times in 7 days.
- Total defective parts are 110 and the total defect type occurred is 133, which means the number of defects that occurred is more than the total defective parts. This indicates that there are many parts that have more than one defect.
Check out –Check sheet excel template.
With this example, hope you got the clarity of how the sheet records data. This recorded data is further used as input data to create a Pareto chart, Histogram, and Bar graph, in order to see the frequency of occurrence of data graphically.
Conclusion –
The check sheet is one of the powerful quality tools used during the DMAIC project or we can say useful during most of the problem-solving work in industries. It is easy to use and provides important data related to defect type, location, and cause of the defect. Throughout this article, we have seen how effective this tool is.
We discussed the fundamental concept of a check sheet, its benefits, and its applications along with different types of sheets. We also discussed the steps for creating the sheet and its interpretation with one example. I hope with this complete guide you understood this topic well.
So If you found this useful then please share it in your network and subscribe to get more such articles weekly.

 in Project Management?")
