

Hypothesis testing is a big headache when it comes to non parametric tests because people find it difficult to perform these tests and also to interpret their results. It has a wide range of applications in problem-solving.
To master these non parametric tests, we need to understand them with the help of practical case studies because the application of these tests on real-life problems will give us an idea about when to use which non parametric test. In this article, I am going to discuss the concept of these tests in detail. Let’s start…

What is non parametric test?
While performing a six sigma project or any problem-solving project, businesses need hypothesis testing to analyze data and draw meaningful conclusions about the population from the sample data. There are two types of hypothesis tests generally used depending upon the distribution of data.
Parametric and non parametric hypothesis tests (NPT), both these methods used in different cases. Parametric tests are used when sample data is normally distributed and these tests are mostly used in improvement projects. But when sample data does not follow a normal distribution, in that case, we have to go for NPT tests.
If data is normally distributed – parametric test
if data is non-normally distributed – non-parametric test
NPT test does not assume anything about underlying distribution it is also called a distribution-free test. They are useful when your data are strongly non-normal and resistant to transformation.
These tests can effectively be performed on continuous non-normal data, discrete and attribute data when you have a sufficient sample size. i.e 15 to 20 items in each sample group.
We know the different types of parametric tests like t-test, z-test, etc. which are useful in many applications but when the sample data is non-normal then the NPT test serves as an alternative to parametric tests. Look at the table below-

This table clearly shows the different types of NPT tests which are the non-parametric alternative of the listed parametric tests. One thing you should understand that in the parametric test we compare the means of the sample group and in the NPT test we compare the medians of sample groups.
Why is this? we will talk about its reason later in this article, right now just remember it. See we are not going into the depth of each type of NPT test here, we will just take an overview of these. If you want to master these all types of Non-parametric test then I have one surprise for you, check out (Master all 7 types of non parametric tests)
For example, the 1-sample sign test and 1-sample Wilcoxon test are the non-parametric alternatives of parametric 1 sample z-test and t-test, in which we compare the median of the sample groups with target median value.
- Example – Compare the median lead time of the process with the target lead time value.
Wilcoxon test for paired data is the non-parametric alternative of parametric paired t-test, in which we compare the median of two paired-sample groups which come from the same population.
- Example – Compare blood pressure of patients after treatment and before treatment, (two paired-sample groups before treatment and after treatment measurement) (from the same population – BP measurement of patients).
Mann-Whitney test is the non-parametric alternative of parametric 2- sample t-test, in which we compare the median of two independent sample groups with each other.
- Example – Compare median cycle time of machine A and B
Similarly, the Kruskal Wallis test and Mood’s median test are the non-parametric alternative of the parametric ANOVA test, in which we compare the median of more than 2 sample groups with each other.
- Example – Compare operations of three different plants of the company A, B, and C.
Again, the Friedman test is the non-parametric alternative of the parametric two-way ANOVA test, in which we compare different treatment effects on the same sample data.
- Example – Compare treatment effect of treatments A, B, and C on patient’s data.
These are the important NPT test which is used as a non parametric alternative to the parametric test when the data is not normally distributed.
Advantages of non parametric tests
- NPT tests are called distribution-free test because it has very few numbers of assumptions but while performing parametric tests you have to follow certain assumptions like normality assumptions.
- Because of few assumptions, NPT tests are easier to perform and more robust in nature.
- NPT tests are useful to reduce the effect of outliers and variance heterogeneity on our final test results.
- They can be applied to a large number of situations and can be used with more types of data also effectively used for the smaller sample sizes.
- Due to their robust nature, they are not seriously affected by the extreme values in the data like outliers.
These advantages motivate analysts or problem solvers to use these NPT tests. However, these NPT tests do have their own disadvantages, let’s have look at that.
Disadvantage of non parametric tests
- NPT tests are statistically less powerful as well as less efficient as compared to parametric tests.
- Even though these tests are applicable in many areas but due to less accuracy they may not provide the ideal results which we want.
- The results of NPT tests are more difficult to interpret because in these tests we assign ranks to the data values instead of using original data values.
- Assigning these ranks to sample data, makes the data more complicated to understand while performing the NPT test.
I am sure you understood the non-parametric test advantages and disadvantages. Now, let’s compare parametric and non-parametric tests on different parameters.
Parametric and non parametric tests –
Parametric vs Non-parametric tests comparison is based on 6 essential factors that you need to understand, its basic definition, Measurement level data, Measure of central tendency, Powerful results, Outliers, and Applicability. let’s understand each of these factors one by one.
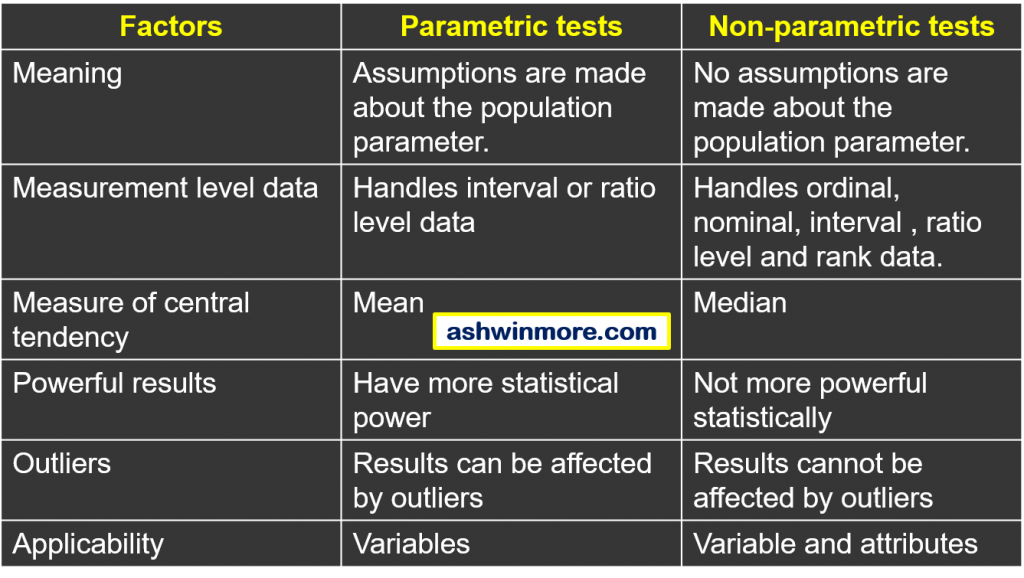
Meaning –
Parametric tests are the statistical tests in which specific assumptions are made about the population parameter means the tests like the Z test, T-test, and ANOVA in which we always assume that the sample data that we collected is coming from the normally distributed population.
On the other hand, non-parametric tests are statistical tests in which no assumptions are made about the population from which the sample has been drawn. It means NPT tests do not assume anything about population hence it is distribution-free tests.
Measurement level data –
Parametric tests can handle interval as well as ratio-level data. Interval data means the data that can be arranged in an ordering scheme and differences between the data values can be interpreted. eg – temperature in degrees Celcius.
Ratio level data means the data that can be ranked where all the arithmetic operations including division can be performed on the data set. Ratio level data has absolute zero value, eg- weight, length, etc.
On the other hand, NPT tests handle all types of data, i.e nominal, ordinal, interval as well as ratio level data, and rank data.
Here nominal data means the data that can not be arranged in an ordering form and no arithmetic operations are performed on this data. eg- blood group type A, B, O, AB.
While ordinal data means the data that can be arranged in an ordering form but no arithmetic operations are performed on this data.
Eg- product rating like good, bad, worst, excellent. Rank data means just assigning ranks to data values from lowest to highest. (Large data value – High rank and Small data value – Low rank)
Measure of central tendency –
Parametric tests are applicable when the mean better represents the center of a distribution. In parametric tests, we compare the mean of the sample group with each other.
eg – In the 1-sample Z-test and T-test we compare the mean of the sample group with the target mean value. On the other hand, non-parametric tests are applicable when the median better represents the center of a distribution.
We talked about this earlier the NPT test compares the median of the sample group with each other. eg – In 1 sample sign test we compare the median of the sample group with the target median value.
Powerful results –
When I say powerful results, non-parametric tests provide statistically less powerful results than parametric tests and this happens because NPT tests have fewer assumptions so these tests may not provide the ideal results which we want.
On the other hand, parametric tests provide statistically more powerful results, that’s why preferred in most applications but when normality assumptions fail then we need to think about non-parametric tests.
Outliers –
Parametric tests are significantly affected by outliers. In the case of extreme values or outliers in data, parametric tests do not provide accurate results. That’s why we need to apply NPT tests in such cases because these tests do not seriously affect by outliers.
Applicability –
Parametric tests are applicable in the case of continuous or variable data sets like length, mass, etc. On the other hand, NPT tests are applicable in the case of variable as well as attribute data (eg- pass/fail or yes/no).
I hope you understood that what is the difference between parametric and non parametric tests. Now, let’s see when to use these NPT tests.
When to use non parametric tests –
NPT tests are applicable when the data are ranked in order. In these tests, we assign ranks to the data values and analyze results using ranks, instead of using original data for assessment. So if you come across any problems where you need to assess the ranks of data then you should use NPT tests for analysis.
There are situations when your data consist of extreme values or outliers, in that case, the mean of sample data gets affected so in such cases median better represents the center of the distribution. And we already talked about this when the median better represents the center of distribution then you must use NPT tests for analysis.
There is a general rule that states “when your data follows normal distribution use parametric tests and when your data follows non-normal distribution then go for non parametric tests“. There are some situations when data does not follow a normal distribution. let’s have a look at that –
1. When the outcome is rank or ordinal variable –
We already talked about what ordinal data is, for example – suppose you are a quality engineer in a smartphone company, and today, you have asked to check the quality of a mobile phone after repair and you should measure the quality of the mobile phone on the basis of 5 points ordinal scale with the response option of worst mobile, good mobile, average mobile. excellent mobile etc. So whatever data you will collect here is ordinal data.
Similarly, rank data means in the same example instead of 5 points ordinal scale if you have asked to rank the mobile phones on the basis of its feature from 1 to 10. Then at the end whatever data you collect here is rank data. So both these types of data do not follow a normal distribution and to analyze it we need to use NPT tests.
2. When there are a number of explicit outliers –
As we discussed in the 2nd paragraph of this point, when there is an outlier in data, the mean of sample data gets affected, and hence distribution does not follow normality. To assess the such type of data set we need to use NPT tests.
3. When the outcome has a clear limit of detection –
See in some studies or in some analysis the outcome is a continuous variable that is measured with a clear limit of detection. Because some instruments can not measure the presence of specific quantities above and below certain limits. Right! Ok, let’s take one example to understand this clear limit of detection. –
Example – the detection of HIV aids in blood samples.
Suppose there are 10 chemists who are checking the blood samples for HIV detection, for that they are measuring HIV viral load ( Viral load means a measure of the amount of virus present in the blood samples.)
So they are performing this test and the outcomes of this test range from “Not detected virus to 100 million copies of the virus in blood samples”. They performed this test and got different outcomes. See the outcomes in below table –

As per the table, 6 chemists found the outcome as “Not detected virus in the blood sample” and the remaining 4 chemists got some numeric values in the outcome like 1lakh copies, 8 lakh copies, etc.
So the outcome of this test is a combination of numeric values and a clear limit of detection. If we plot the distribution of this outcome then we will not get the normal distribution due to the limit of detection.
This type of outcome results in non-normal distribution and to analyze such outcome data we have to go for non-parametric tests. So In all these situations which we just discussed you should use NPT tests.
Alright! Up till now, we talked about all the basic fundamentals of NPT statistics tests. But now the big question is how one can apply these types of NPT tests to solve real-life problems. and How one can learn those tests and interpret their results. For that we have the best solution for you, see below!
Master types of Non parametric tests –
There are 7 important types of non-parametric tests that are useful as a non parametric alternative to parametric tests. Each of these tests uses under different conditions and follows different steps.
You can perform these tests on Minitab software as well as manually by doing calculations. For that, we created one course in which you will learn – (Master all types of NPT tests)
- All important types of Non-parametric testing by using 13 practical case study-based examples.
- 7 important types of Non-parametric hypothesis testing by using the traditional method as well as the P-value method on Minitab.
- 1- sample sign test
- 1-sample Wilcoxon test.
- Wilcoxon test for paired data.
- Mann-Whitney test.
- Mood’s median test.
- Kruskal Wallis test.
- Friedman test.

Why enroll –
Lean Six Sigma certification exams like IASSC/ASQ Lean Six Sigma Green belt and IASSC/ASQ Lean Six Sigma Black belt most of the time ask questions on Non-parametric hypothesis testing.
In the ICGB exam, 8 to 9 questions are being asked, and similarly, in the ICBB exam, 13 to 14 questions are being asked on this topic so all those who are preparing for Lean Six Sigma certification exams like ICGB, and ICBB can join this course because this course will help you in preparing for this difficult topic and then you can easily answer the questions based on Non-parametric hypothesis testing.
If you want to expand your knowledge about hypothesis testing or want to learn Non-parametric testing then definitely you should join this course because Hypothesis testing has a wide range of applications in Research work, Business decision-making, AI & ML, Lean Six Sigma, etc.
While selecting hypothesis testing for any application it is important that you need to have the knowledge of Parametric as well as Non parametric testing so that you can select accurate tests to analyze your data.
Who can enroll in this course
- Anyone who wants to expand their knowledge of hypothesis testing and wants to understand Non parametric hypothesis testing along with its application.
- Students/professionals who are preparing for Lean Six Sigma certification exams like IASSC green belt/ IASSC black belt or ASQ exams.
So if you are interested then check out the course on Udemy available at an affordable cost. Go through ratings and reviews and also ask your doubts about the course.
Once you become ready to enroll just use this discount link – Master all types of nonparametric tests
Conclusion
We talked about all the basic fundamental concepts of non parametric tests and also discussed their comparison with parametric tests most important we understood the application of these tests.
So It is essential for analysts, quality engineers, and Lean Six Sigma professionals to learn the non-parametric test because when normality fails the best option you have is to use non parametric tests to analyze non-normal data.
If you found this article useful then please share it in your network and subscribe to get more such articles. (Enroll now – Master Non-parametric tests using 13 case study examples)


Pingback: What is hypothesis testing in statistics? Step by Step guide