

Value stream mapping is a process that helps companies see the big picture of their daily operations. It can help them identify and eliminate waste in their process.
The ultimate goal of this powerful lean tool Value Stream Mapping is to improve the flow of materials and information throughout the company.
In this article, we are going to understand the value stream mapping in detail like what is VSM, its benefits, example, the history & features of VSM, Different VSM symbols, its advantages, and disadvantages, and at last, we will understand its practical aspect i.e. how to do VSM? etc.
In the end, you will get complete clarity on how useful this tool is and how you can apply this powerful lean tool called Value stream map at your workplace. So Let’s start…
What is Value stream mapping?
We humans are very good at processing information easily when it is available in a visual format right! any information or data from our daily life or from our workplace if it is available in the visual format it becomes easy for us to understand that information.
At the workplace also a lot of activities are going on daily, different processes are running continuously, and a huge amount of information and material is flowing through the company, so to understand these complex activities and process flow we need something that can help us provide this information and data in a visual format.
That is where a powerful tool called Value stream mapping is required. VSM is one of the most popular Lean tools used to identify and visualize the flow of material and information from supplier to customers. It not only visualizes the process flow but also identifies waste in the process as well as process improvement opportunities.
This map includes all steps in the entire process from the time the customer request is received to the time the product is delivered. It provides a complete picture of the process in a visual format.
Value stream mapping uses different symbols and colors to represent the different steps in the process and the amount of time it takes for each step by identifying the sources of waste businesses can improve efficiency and reduce cost.
We know that the basic purpose of Lean implementation is to eliminate waste (Muda), which means eliminating all the non-value-added activities in the process.
Non-value-added activities means the activities that the customer is not willing to pay for or you can say the activities that are not important from the customer’s point of view. (Related content – Understand 8 types of waste in lean manufacturing.)

Value stream mapping provides the foundation for Lean implementation by identifying all the value-added and non-value-added activities in the process. So if you ask which tool speeds up the lean implementation then that is definitely a value stream map.
VSM visually represents all the essential steps in the process that are necessary to deliver value from the customer’s perspective. It provides a visual overview of every step or task in the process that employees are working on with required details and progress reports.
VSM creates a visual representation of the current state of the process and identifies areas for improvement in the process, identifies waste and inefficiencies, and is also used to make decisions about how to improve the process or improve the flow of materials and information within and between the organization.
By visualizing the process flow, Value stream mapping helps the organization improve the value creation for both customers and suppliers by reducing waste (non-value added activities) in the process as well as improving overall productivity.
History of VSM –
Initially, Value stream mapping was considered a minor tool in Toyota it has been around for quite a while. At the end of the 20th century when the Lean principle got popular in different industries like manufacturing, services, and IT operations so did the value stream mapping also got spread across different industries as popular practice.
In 1990, the book was written by James Womack “the machine that changed the world” which first introduced the term called value stream map. Later VSM methodology was then popularized by the same author James Womack through his 2nd book “Lean thinking”
His books mentioned that the VSM is a sequence of activities an organization undertakes to deliver on a customer request. VSM is considered as one of the bases that made Toyota’s production system popular across the globe.
The invention of Value stream mapping is attributed to the Toyota Motor Corporation, Toyota’s success, and Lean manufacturing practices promote VSM as the modern best tool for improving value creation and waste reduction in the process. (Related content – What is Lean manufacturing complete guide for 2024?)
Features of VSM –
If you are working on a complex process then Value stream mapping can help you create a comprehensive view and understanding of that entire process which then helps you improve that process. Here are some of the most important features of Value stream mapping that make this tool very useful –
- It is a powerful visual planning tool that identifies areas for improvement and finds ways to improve them.
- It tries to improve the efficiency and performance of the system.
- It tracks the actual processes or system and tries to improve it.
- In addition to that, it also identifies and eliminates all 8 types of waste in Lean.
- It provides a top-down visual view of your business processes with details of value-added and non-value-added activities.
Application of VSM –
As we know value stream mapping is associated with lean manufacturing methodology. It is used in different industries like service, manufacturing, software development, administrative and office processes, etc. to provide a visual representation of material and information flow.
- In the manufacturing industry, while designing a new manufacturing line when there is a need to create a process flow you can use a value stream map.
- Sometimes the flow of material is not providing the required results that the organization is looking for, also sometimes the flow of information in the current process line is not working properly then in such cases value stream map can be used to improve the flow of the system or entire process.
- This map can be used to reduce the unevenness of material and information flow in the process. It can also be used in the processes that have to be updated.
Symbols used in Value stream map –
Value stream mapping uses symbols and connections to show the flow of material and information within the system. Symbols make it easy to visualize and represent the process information in the value stream map.
In value stream mapping we have four categories of symbols i.e. Process flow symbol, Material flow symbol, Information flow symbol, and last is general symbols.
Each of these categories has a list of symbols that are used to represent the process flow in the value stream map. Let’s see those symbols one by one –
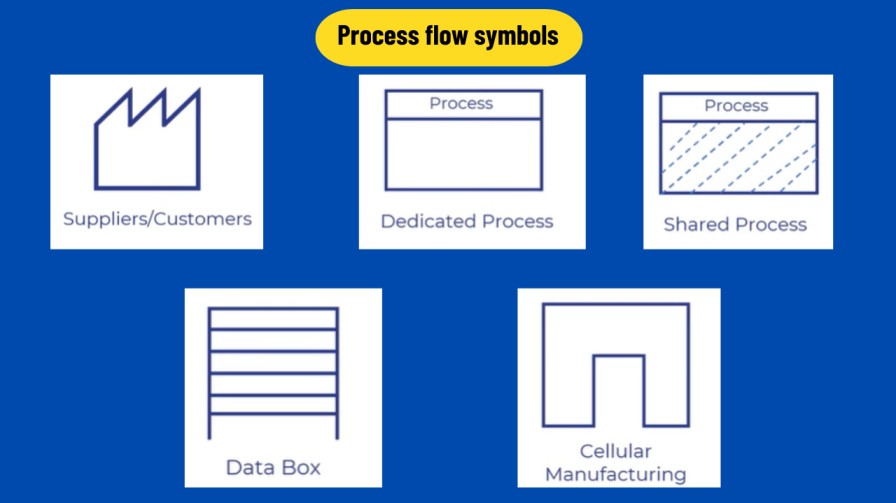
Process flow symbols –
- Suppliers and customers – both the symbols are nearly the same. On the top side, if the symbol is on the leftmost side then it is suppliers and if it is on the rightmost side then it is customers.
- Process box – This represents the process steps in the entire process. The name of the process step is written on the top of the process box.
- Shared process – This represents the process operations department that other value stream families share.
- Data box – It is a simple table where the relevant information is written related to the process boxes.
- Cellular manufacturing – This indicates that multiple processes are integrated with a manufacturing work cell.
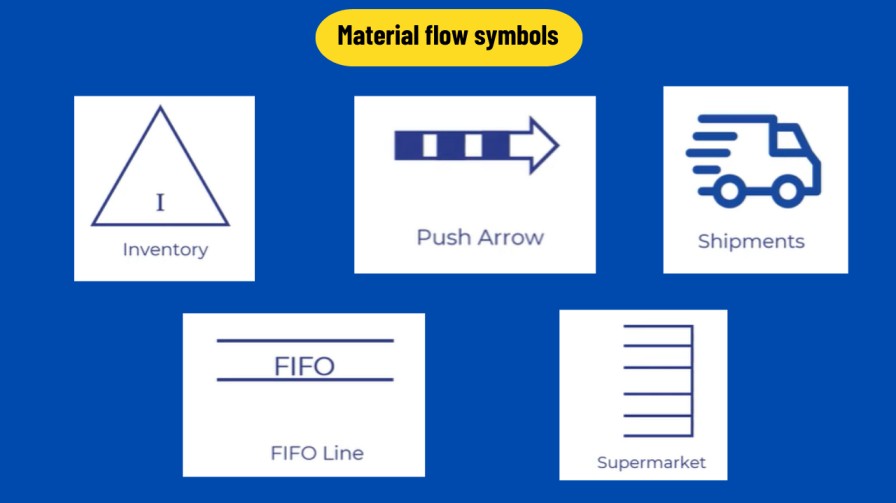
Material flow symbols –
- Inventory – The inventory triangle shows inventory between two processes which is located at the bottom of VSM between two process boxes.
- Push Arrow – It shows that pushing material from the current process to the next process.
- Shipments – This symbol represents that ship from suppliers or to customers using external transport.
- Supermarkets – It indicates the kanban stock point where customers can get the inventory they need from upstream suppliers.
- FIFO line – This symbol represents the First in First out inventory system that limits inventory inputs.
Information flow symbols –
- Straight line – It shows mutual information flow through memos, reports, and conversations.
- Jagged line – It shows the electronic information flow between processes.
- Kanban post – It shows the place where Kanban cards are collected.
- Go-see scheduling – This indicates that information is being collected through physical observations.
- Production control – It is nothing but the centralized production control and scheduling department.
- Load leveling – This batches kanban in order to level out the variety and volume of production.
- MRP/ERP – Material planning system; scheduling using an inventory control system is done through this.
- Verbal information flow – Represents information flow that is passed verbally.

General symbols –
- Kaizen burst – This symbol highlights the improvement needs in specific processes that are critical to achieving the future state map of the value stream.
- Operator – It shows how many operators are needed to process the VSM family.
- Timeline – This symbol is placed at the bottom of VSM and shows both waiting times and processing times.

These are some of the most important symbols that we have just discussed and you will understand the use of these symbols more clearly when you start Value stream mapping at your workplace.
But if you want to understand how to create VSM practically using these symbols then join EALSS Academy’s 2 days practical workshop on Value stream mapping –
Enroll now – Become Certified Value Stream Mapping Practitioner
How to create a Value stream map?
With the help of a value stream map, we can evaluate the current state of the production process to identify what is working and what issues are causing inefficiency once a current state map has been completely analyzed, future and ideal state maps can be created to improve the organization. Let’s understand how to create VSM step by step –
1) Initially identify the scope of the Value stream map –
Identify the start point and end point of the general process and draw them on paper. While drawing the map, place the Start point in the top left corner and the endpoint in the top right corner of the paper.
For most processes start point is generally considered as the Raw material supplier and the endpoint is the customer who gets the value at the end of the process. Use proper shapes/symbols to draw the start and end points of the process.
After that next to the customer (endpoint) record the takt time. Takt time is the calculated rate at which you need to complete a product to meet customer demand. Mathematically it is calculated like TAKT time = Total Available production time divided by Average customer demand.

2) Start mapping the process –
At this step, you need to use all the different VSM symbols that we discussed earlier. 1st use the process box symbol to show all the steps involved in the process, all these process boxes come at the bottom side of the paper/document.
Each step in the process is shown using the Process box symbol and each of these boxes has one small circle at the bottom left corner that indicates how many operators are involved to complete the particular step of the process.
Below each process box, there is a data box that is attached to the process box for all the steps in the process. This data box includes data like cycle time, changeover time, yield, uptime, lead time, etc. for each step in the process.
- Cycle time – Simply the time from beginning to completion of a process step.
- Lead time – The total time between process step initiation and completion.
- Changeover time – The time required to switch from one process step to another.
- Uptime – Percentage of time in which machine or process is running.
- Yield – Percentage of time that product passes through a process steps without any defects.
Learn VSM practically – Become Certified Value Stream Mapping Practitioner

3) Start adding Inventories and wait times –
This step is all about adding inventory and wait time in the Value stream map. But before that connect all the process boxes as well as the start and end points of the process with the help of arrows. By connecting this you can get to know the entire process flow.
On the left side connect Suppliers to the 1st process box using a thick line arrow (shows shipments) and this line shows the supplier ships raw material to the company.
Similarly, on the right side connect the last process box and customers using the same thick line arrow, and this line shows the company ships finished products to the customers.
On these shipment arrows, you can add symbols like a truck or airplane to show the mode of transportation. After that connect all the process boxes using the dotted arrow or push arrows and these arrows show material is pushed from one process step to another.
Next, Add the inventory triangle in between each process step or process box. The inventory triangle shows the number of parts you have at work in progress at the end of each process step.

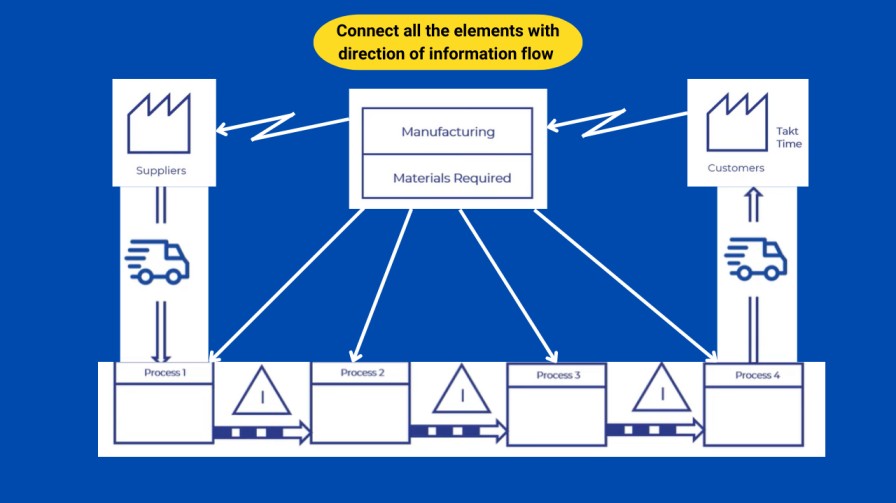
4) Connect all the process elements with the direction of information flows –
As we know Value stream map not only shows the production process flow but also represents the flow of information throughout the process. At this step, show the information flow between all elements of the Value stream map.
1st Add a production control box in between the start and end process steps on the top side. The production control box represents controlling production and people scheduling and also at the bottom of that box, you can add the responsibilities of the group involved in scheduling and controlling production.
After placing everything in the proper place, next is to connect the top side symbols using a jagged line that shows electronic communication like fax, email, phone, etc. You can add notes there like the type of data exchanged, frequency of exchange, and the type of media used.
After that connect the production control box and all the process boxes using a straight line that shows manual communication like memos, printed reports, or in-person conversations.
See the example below – the production control box which is present between the start point (supplier) and endpoint (customers). You can see that the production control box receives the order from the customer and then it sends the daily/weekly forecasts to the suppliers.
This transfer of information happens electronically (via mail, fax, phone, etc.) and then they give daily schedules to the staff members through in-person conversation.
5) Create a timeline for the process step –
As we know the purpose of value stream mapping is to identify waste in the process and to fulfill that purpose creating a timeline on the map is very important. In this step, you need to create the timeline at the bottom of the value stream map.
The timeline has two levels, initially on the bottom write down the times for value-added processes taken from the process boxes above, and on the top, write down the times for non-value-added processes.
After that calculate the time accurately and monitor efficiency. That’s how you complete the value stream map. Once the calculation is done and the map is ready, you need to put that time into action.
Check process steps if it’s taking a huge time or if it has more non-value elements then remove waste and track efficiency, then alternate the process and map accordingly where you can find the least waste.
That means updating the Value stream map as needed so that it can accurately reflect your current processes. On the right side of the timeline, you can add a data box that includes all the time-related information like…
- Production lead time (PLT) – The time it takes to create a product and deliver it to the customer. In the context of VSM, this is the total non-value-added time from the top of the timeline.
- Value added time (VAT) – The time that is spent on the improvement of process outcome. In the context of VSM, this is the total value-added time from the bottom of the timeline.
- Process cycle efficiency (PCE) – The percentage of total value added time in the process out of total process time.

That’s how you can create a value stream map by following these steps. Initially, you can start with a pen and pencil, and then you can take the help of Value Stream Mapping software.
The software can help you create a final map in a faster way with the help of standard templates and you can save a lot of your time. (Check out – How to create a Value stream map in Excel? )
If you want to learn Value stream mapping practically with the help of 2 case studies from manufacturing and 1 case study from service then register for the workshop conducted by EALSS Academy. Check out the link below –
Enroll now – Become Certified Value Stream Mapping Practitioner
Benefits of Value Stream Map –
- Value stream mapping helps us understand where we stand in our process.
- It helps us identify non-value-added activities like rejection, rework, extra motion, losses, excess change over time, excess cycle time, etc.
- It helps us identify bottleneck activities where we are unable to meet customer demand it may be due to non-value-added activities.
- It helps to focus on the overall performance of the entire organization not only on department wise.
- It helps you analyze your current state of process in-depth and also provides some meaningful insights regarding how you can make changes to improve the way you work and focus on future improvement.
- It forms the basis of a Lean implementation plan. By helping you design how the whole door-to-door flow should operate – a missing piece in many lean efforts, VSM becomes a blueprint for Lean implementation.
- Overall it helps to maximize the value and minimize waste with the help of a visual representation of process flow.
Conclusion –
Value stream mapping is considered one of the most powerful Lean tools because it speeds up the process of Lean implementation by identifying waste in the process.
It helps organizations in the process of building a continuous improvement culture and also optimizes the way organizations deliver value to their customers.
In this article we discussed the history, features, benefits, and application of this powerful tool, we also understood the meaning of different symbols used in Value stream mapping to represent process flow, and then in the end we also understood how to create value stream map with the help of one example.
I hope you find this article helpful in learning VSM. If you found this article useful then please share it in your network and subscribe to get more such articles every week.


Pingback: What is DMAIC process? 5 steps process improvement methodology
interested in lean six sigma
Check out our platform EALSS Academy and you will get all the details there.
Pingback: Kaizen Tools: 5 Tools You Must Know for Continuous Improvement
Pingback: Standard Work in Lean Manufacturing: How to Apply at Workplace?
Pingback: What is COPQ (Cost of Poor Quality)? Complete Guide for 2024