

Hypothesis testing in statistics is one of the most important analytical tools which helps businesses make data-based decisions without any error. It combines tested techniques. real-world data and effective procedure that allows testing assumptions or claims on the basis of beliefs, evidence, etc. to make better decisions.
Understanding this concept is a little bit confusing but with this article, I am going to make it very easy for you to understand. In this article, I am going to cover all the terminologies related to hypothesis testing in statistics with real-world examples so that in the end your fundamentals become strong. Let’s start…
What is hypothesis testing in statistics?
Hypothesis testing in statistics is the process of statistical analysis in which analysts test the claim. It is used when there’s a claim made about a population parameter and we need to verify the correctness of that claim. It is basically the claim that we want to test. Let’s understand this with an example –
Suppose I have 10 years old car and my neighbors replaced their old car with a new one because of a maintenance issue. My father has a doubt that our car is also old, whether our car has a maintenance issue and we also need to replace it with a new one or our car is still in good condition don’t need replacement.
So in this given scenario hypothesis is whether the car needs to be replaced with a new one or not. Here I think that my car is in good condition, on the other hand, my father made a claim that the car has a maintenance issue so we need to replace it.
- I think – My car is in good condition and not in need of replacement.
- My father (claim) – My car has a maintenance issue so needs to be replaced.

I need to do some statistical analysis to prove whether I am right or my father’s claim is right. That’s how hypothetical analysis is helpful to prove or disprove the claim. Let’s see one more example to get a clear idea…
Suppose you and your friends have decided to watch Marvel’s infinity war movie tomorrow and you all will be in the theater at 1 P.M tomorrow. Today night after lunch you guys gathered together to discuss the movie.
During the discussion initially, you made a statement that a Movie is good to watch and you made this statement on the basis of your own experiences with Marvel’s movie. On the other hand, some of your friends do not agree with you so they made another statement (claim) the movie is not that good.
You all decided to verify the claim. On the next day, after watching the movie 8 out of 10 friends supported your statement, they liked the movie overall. As the majority agrees with your statement you made final conclusion that a movie is good to watch.
- You think – Movie is good.
- Friend thinks (claim) – Movie is not good.

These are the basic example of hypothesis testing in statistics in which we need to test the claim on the basis of data to make fact-based decisions. This is very useful in the Six Sigma project also because as we know six sigma is a data-driven methodology so to make data-based decisions hypothesis testing in statistics will be used.
While doing the Six Sigma project our goal is to improve our process capability, this translates to the need to move the process mean and reduce the standard deviation.
To do this we need data and we know it is too expensive or too impractical to collect population data and make decisions on the basis of population data. That’s where we have to go for an easy option i.e. to make a decision based on sample data.
But as we are dealing with sample data, there is some uncertainty about the true population parameters. To overcome that uncertainty we use hypothesis testing because it helps us make fact-based decisions about whether there are different population parameters or that differences are just due to expected sample variation.
It is the problem solving or decision making based on the statistical inferences that use data from the sample to draw conclusions about the population parameter where we convert the practical business problem into the statistical problem to find its solution.
The purpose of hypothesis testing in statistics is to integrate the voice of process with the voice of business to make data-based decisions to resolve problems. This can help avoid the high cost of experiment efforts by using existing data. These data-based decisions are based on –
- Beliefs (past experiences)
- Preferences (current needs)
- Evidence (statistical data)
- Risk (acceptable level of failure)
Two main types of hypothesis testing –
Data is one of the most important elements of a hypothesis test. To perform hypothesis testing in statistics we need accurate data which helps us to make data-based decisions. There are two main types of hypothesis tests depending on the type of data. Generally, we have normal data or non-normal type of data in all hypothetical estimates.
So while performing these tests initially we need to assess the normality of data and check whether it is normal or non-normal. Depending upon that we have to choose the hypothesis tests. So two main types of hypothesis tests are parametric tests and Non-parametric tests. Let’s have a look at that…
Parametric tests –
Parametric hypothesis tests are used when the data is normal and it compares the mean of the population or sample groups. It is used to analyze all types of normally distributed data. In this category, we have 4 types of hypothesis tests –
- 1/2-sample Z-test
- 1/2- sample T-test
- Paired T-test
- Analysis of variance test (ANOVA)
- Two way ANOVA
Non-parametric tests –
Non-parametric hypothesis tests are used when the data is non-normal and it compares the median of the population or sample groups. It is used to analyze all types of non-normally distributed data. In this category, we have 4 types of hypothesis tests –
- 1-sample Wilcoxon test
- 1-sample sign test
- Mann-Whitney test
- Mood’s median test
- Kruskal Wallis test
- Friedman test
If data is normally distributed – parametric test
if data is non-normally distributed – non-parametric test
Related content: What is a non-parametric test? the best way to analyze non-normal data
These all type of parametric and non-parametric tests follows different procedure and are used in different scenarios. Here we just take an overview of these tests and we will discuss each test separately with one example in the upcoming articles. But for now, I am going to focus only on the basic concepts of hypothesis testing in statistics.
Important concepts in hypothesis testing –
In order to perform hypothesis testing in statistics and interpret its results, we must have a proper understanding of some of the basic concepts of hypothesis testing. Let’s discuss the important concepts one by one –
Null and Alternate hypothesis –
Whenever you perform hypothesis testing in statistics, you have to propose two hypothetical conditions at the start i.e. Null and alternate hypothesis. This is actually the first step of hypothesis testing where we need to define the two conditions.
Null hypothesis(Ho) – Default assumptions.
Alternate hypothesis(Ha) – Research hypothesis
The null hypothesis is denoted by Ho and it is nothing but the basic assumptions behind doing any activity or we can say it is the existing fact i.e. Default assumption. On the other hand, the Alternate hypothesis is something that we claim to test and it is opposite to the null hypothesis. Denoted by Ha, we can call it a research hypothesis.
Let’s come back to our old car example, initially, my father have doubt that the car is not in good condition so this is the claim I want to test but in reality, the car is working fine, it is in good condition. So…
- Null hypothesis in this example is – My car is good in a condition and no need of replacement i.e. existing fact.
- Alternate hypothesis is – My car has a maintenance issue so needs to be replaced. i.e. claim.
Similarly for the other example of Marvel’s movie, before watching that movie you assumed that the movie is good and some of your friends assumed that movie is not good. So here the claim is to test whether a movie is good or not, that means…
- Null hypothesis in this example is – Movie is good i.e. existing fact.
- Alternate hypothesis is – Movie is not good i.e. claim.

I hope you got the concept of these two conditions. While performing hypothesis testing in statistics you have to define these two conditions at the start and based on the evidence/data information you need to reject one condition to make final conclusion.
Always remember that you can either reject the null hypothesis or fail to reject it. But never accept the null hypothesis because this is an existing fact.
Both null and alternate hypotheses are complementary to each other, at the end of the hypothesis test in the result you always have either a null hypothesis or an alternate hypothesis not both at the same time.
One more important concept I would like to discuss here i.e. Alternate hypothesis can be one-sided or two-sided. What does this one-sided or two-sided alternate hypothesis mean? One-sided means one-directional assessment of claim or alternate hypothesis and Two-sided means non-directional/both directional assessment of claim or alternate hypothesis.
One-tailed test –
The hypothesis tests which test the claim one-sided or in a specific direction are called one-tailed tests. A one-tailed test allows you to determine if the mean/median of the sample group is greater/less than the target mean/median value (for a 1-sample test) or it is greater/less than the other sample group mean/median value (for 2 sample test).
Example – Suppose a quality engineer wants to compare the mean production time of machines A and B. He wants to assess the claim of the supervisor that the production rate of Machine A is greater than B. So he decided to do this using hypothesis testing and then he defined the two hypothetical conditions. See below –
- Ho: Ma = Mb (Where Ma and Mb are mean of the production rate of machines A and B)
- H1: Ma > Mb (Claim)

So here if you look at the alternate hypothesis statement you will find that the claim assessment is in one direction only i.e. claim of the supervisor that the production rate of Machine A is greater than B. Hence this is called a one-tailed test.
If the Claim is like – the production rate of Machine A is less than B then also it is a one-directional assessment and considered a one-tailed test. So when hypothetical conditions are like those given below in all that cases you have to follow the procedure of the one-tailed hypothesis test to get the results.
- Ho: Ma = Mb
- H1: Ma > Mb or Ma<Mb (assessing claim in one direction)
Two-tailed test –
The hypothesis tests which test the claim two-sided or in both directions are called two-tailed tests. A two-tailed test allows you to determine if the mean/median of the sample group is equal/not equal to the target mean/median value (for a 1-sample test) or if it is equal/not equal to the other sample group mean/median value (for 2 sample test).
Example – Suppose in the same example a quality engineer wants to compare the mean production time of machines A and B. This time he wants to assess the claim of the supervisor that the production rate of Machine A not equal to machine B.
This time it’s not greater or less, testing of claim is in both directions. So he decided to do this using hypothesis testing and then he defined the two hypothetical conditions. See below –
- Ho: Ma = Mb (Where Ma and Mb are mean of the production rate of machines A and B)
- H1: Ma ≠ Mb (Claim)
So here if you look at the alternate hypothesis statement you will find that the claim assessment this time is in both directions i.e. claim of the supervisor that the production rate of Machine A not equal to B. Hence this is called a two-tailed test.
It is very important that you need to know whether your claim is one-sided or two-sided at the start of hypothesis testing in statistics because all your next steps depend on this. I hope you got these two concepts, see at the time of the example discussion you will get more clarity so don’t worry.
Type 1 and Type 2 errors –
While performing hypothesis testing in statistics, whenever you would take these kinds of decisions of rejecting Ho or Ha, they are not 100% right all the time. It could be right or wrong because there is always a possibility of error in your decision. These errors are nothing but type 1 and type 2 errors in hypothesis testing. Let’s discuss these two –
Type 1 error occurs when we reject the null hypothesis but it is true in reality. It is also called a producer’s risk, for example, a manufacturer producing a good quality product then also it getting rejected in the market. So it is definitely a producer’s risk.
For eg- the trial of an accused criminal
- Null hypothesis – The person is innocent.
- Alternate hypothesis – The person is guilty.
Type 1 error, in this case, would mean that the person is not found innocent based on the evidence and is directly sent to jail despite actually being innocent. So in this situation, the null hypothesis gets rejected even though it is true in reality.
Similarly in Marvel’s movie example, if you all rejected to watch the movie based on your past experience with Marvel and concluded the movie is not good but in reality, it is good to watch, then here you all are making a type 1 error. Because you all agree with the statement that a movie is not good even though it is good to watch.
On the other hand, Type 2 error occurs when we fail to reject the null hypothesis when it is false in reality. It is also called consumer’s risk, for example, a manufacturer producing the worst quality product then also it getting accepted in the market. So it is definitely a consumer’s risk.

Again come back to our example of an accused criminal, for the same hypothetical condition. Type 2 error would mean that the person is found innocent based on the evidence despite actually being guilty. So this situation fails to reject the null hypothesis even though it is false in reality.
Similarly in Marvel’s movie example, if you all decided to watch the movie based on your past experience with Marvel and concluded the movie is good but in reality, it is not good to watch, then here you all are making a type 2 error. Because you all agree with the statement that a movie is good, even though it is not good to watch.
Always remember that a Type 2 error causes more serious consequences than a type 1 error on your final decision of hypothesis testing. So to reduce the impact of these errors we need to focus on increasing our sample size to get better results while performing hypothesis testing in statistics.
Well I know this looks a little bit confusing, how you can remember this concept easily? see below –
- Type 1 error – Innocent declared as guilty.
- Type 2 error – Guilty declared as innocent.
Alpha and Beta Risk –
While performing hypothesis testing in statistics we need to also consider two types of risks i.e. alpha risk & beta risk. Both these risk represents type 1 and type 2 error.
Alpha risk is equal to the probability of making a type 1 error or you can say the probability of rejecting a null hypothesis when it is true in reality. This is associated with type 1 error and is also called a significance level.
In most of the hypothetical estimates, we consider alpha levels equal to 1%, 5%, and 10% depending upon the area where we performing this hypothesis testing like manufacturing/service/pharma domain, etc.
What does that alpha level of 1% or 5% indicate? see alpha equal to 5% means there is a 5% chance we make a type 1 error in our decision or we can say 5% alpha level means there is a 5% chance that we reject the null hypothesis when it is true.
Similarly, a 1% alpha level means there is a 1% chance that we reject the null hypothesis when it is true or we can say there is a 1% chance that we are making a type1 error in our decision.
Then one more concept here i.e. Confidence level. 1- Alpha level = Confidence level so for 5% alpha level the confidence level is 100 – 5% = 95% similarly for 1% alpha level the confidence level is 100 – 1% = 99%. This confidence level will tell you how much percent you are confident about your decision.
Suppose in the example of an accused criminal, we consider alpha level equal to 5% and confidence level equal to 95% and in the final decision type 1 error occurred so the decision is the person is guilty. But as I said this is a type 1 error that means Innocent was declared guilty.
Now carefully see, what alpha and confidence level tells us here. An alpha level of 5 % indicates that there is a 5% chance that the decision is wrong i.e. person is not guilty, on the other hand, a 95% confidence level indicates that there is 95% confidence that decision is right i.e. person is guilty.
So alpha level shows how much doubt we have on our decision and the confidence level shows how much confident we are about our decision. Always consider alpha equal to 1%, 5% because we want to be 99%/95% confident in all types of hypothetical estimates. One thing you should remember here is alpha risk = Type 1 error.

In a similar way, Beta risk represents type 2 error. It is equal to the probability of making a type 2 error or we can say the probability of failing to reject the null hypothesis when that null hypothesis is false.
Generally, the Beta risk is considered as 10% in all types of hypothetical estimates. This 10% beta risk indicates that there is a 10% chance of making a type 2 error in the final decision or we can say a 10% chance that we failed to reject the null hypothesis when it is false in reality.
Then one more concept here i.e. Power of the test. 1- Beta level = Power of the test so for 10% beta level the power of the test is 100 – 10% = 90%. This power of the test shows how much percent confidence you have in the final results of the hypothesis test.
Suppose in the example of an accused criminal, in the final decision type 2 error occurred so the decision is a person is innocent. But as I said this is a type 2 error that means guilty declared as innocent. Here the beta risk of 10% shows that there is a 10% chance that a person is not innocent.
Beta risk is more problematic as compared to alpha risk because it is associated with type 2 error but we can reduce its impact on the final test decisions by increasing the sample size.
Basically ‘risk’ means the probability or chance of making an incorrect decision. These two types of risk will help us to make an accurate decision while performing hypothesis testing in statistics.
If you feel confused let me tell you one easy way to remember this, see Alpha risk = Type 1 error and Beta risk = Type 2 error. This concept may confuse you at the time of first reading so I would suggest you slowly read it twice and I am sure you will understand it.
P-value in hypothesis testing –
Another important concept of hypothesis testing in statistics is P-value. P-value plays an important role while making the final decision about hypothesis testing results. P-value helps us to reject or support the null hypothesis and graphically it is the area in the tails of the distribution.
This value basically provides evidence against the null hypothesis, the smaller the p-value stronger the evidence that you should reject the null hypothesis, and the higher the p-value which means you should reject the alternate hypothesis. So at the end of every hypothesis test, you will get the p-value then you need to make the final decision.
There are standard criteria for P-value that help us to decide when we need to reject the null and alternate hypothesis. As per that criteria we need to compare the P-value with the alpha level, we already talked about the alpha level, so at the start of hypothesis testing analyst considers the alpha level like 5%,1%, etc.
Then in the result, we need to calculate the P-value. To make the final decision P-value needs to be compared with the assumed Alpha level. That’s the last step of any hypothesis test. See the standard criteria –
- If P-value >= 0.05 (alpha level) then reject the alternate hypothesis or failed to reject the null hypothesis.
- If P-value < 0.05 (alpha level) then reject null hypothesis.

For example – you performed the hypothesis test and you got the p-value = 0.032 i.e. 3.2% this indicates there is a 3.2% chance that the final results could be random or happened by the chance. Here P-value is less than 0.05 which means final conclusion would be to reject the null hypothesis.
On the other hand, if you got the larger P-value = 0.85 i.e. 85% this indicates there is an 85% chance that the final results are completely random. Here P-value is more than 0.05 which means final conclusion would be to reject the alternate hypothesis or fail to reject the null hypothesis.
Graphically, P-value is the area of the tails of the probability distribution. It could be on the right side or on the left side, this depends on the type of test whether it is a one-tail hypothesis test or a two-tail hypothesis test.
So at the end of this concept discussion, Let me tell you how you can remember this easily…
- A smaller P-value is strong evidence that your null hypothesis is invalid. (Smaller the P-value then reject Null)
- A higher P-value is strong evidence that your alternate hypothesis is invalid. (Higher the P-value then support Null)
Related content – What is P-value in hypothesis testing in statistics?
Steps for hypothesis testing –
So far we discussed the basic concepts of hypothesis testing in statistics, now let’s see what are the different steps you need to follow while performing hypothesis testing and we will understand this with one basic example –
Example – Suppose, Manager of a Rod manufacturing company wants to determine whether the average diameter of the rods is different from 6cm or not. For that, he measured the rod diameter and collected some sample data, and decided to use hypothesis testing. (Note – we are assuming all the data values without doing the calculation)
Step1: State the practical problem
A practical problem is – Manager wants to test whether the average diameter of rods is different from 6 cm or not. This is the claim that he wants to study and find a practical solution for that.
Step2: State the statistical problem
Converting practical problems into statistical problems means the manager needs to define the null and alternate hypothesis conditions for this problem. So here..
- Null hypothesis (Ho): Md = 6 cm ( Where Md = mean diameter of rod)
- Alternate hypothesis (Ha): Md ≠ 6 cm
Claim testing is not one-directional so this is a two-tailed test. Because the manager needs to ensure that rods are not larger or smaller than 6 cm, that’s why he chooses a two-sided test that states that the population mean is not equal to 6 cm.
Step3: Choose Alpha and Beta risk level
Manager selects alpha level = 5% and Beta level = 10% that means confidence level = 95% and power of the test = 90%. ( Alpha = 5% for manaufacturing problems and 1% for service problems, Beta = 10%)
Step4: Determine sample size and collect data
At this step, the manager determines the sample size i.e. how much sample is needed to perform hypothesis testing and get accurate results (5 steps for calculating sample size). Then he collects the samples of rods and measures their diameter to get data for the study.
Step5: Select the type of hypothesis test
After the collection of data, the manager checks the normality of data using the Anderson darling test in Minitab. There are different methods we can use to test the normality of data but the AD test is easy to apply and provide fast results. (How to test the normality of data?)
As we discussed earlier that for Normal data we use a parametric test and for non-normal data, we use a non-parametric test. So after testing normality, the manager found that the data is normally distributed hence he decided to use a parametric test. There are 4 types of parametric tests, which one he should select? what do you think?
Well, all these 4 types of parametric tests are used in different situations. For example – When we have to compare mean of one sample group with the target mean value then we need to use a 1-sample Z test or T-test.
Similarly, if we have to compare the mean of two sample groups with each other then we can use a 2-sample t-test. For the comparison of more than 2 sample groups, we can use ANOVA. (We will discuss these tests in detail in the upcoming articles.)
In the given problem, there is only one sample group i.e. the diameter of rods and the manager wants to compare it with the target diameter value i.e. 6 cm. Hence manager selected a 1-sample Z-test here as per the condition in the problem.
Step6: Calculate test statistics value
Test statistics value is the standardized value calculated using sample data while performing hypothesis testing in statistics. It is also used to determine whether to reject the null hypothesis.
For all types of parametric and non-parametric tests we have to calculate test statistics value and for that, we need to use some formulas and perform calculations. The calculation procedure is different for different hypothesis testing types.
Every test type has its own test statistics value like for Z test = Z-statistic, T-test = T-statistic, ANOVA = F-statistic etc. So in this example, the manager calculated the Z-statistic value by using sample data (dia of rods). Z-stat = 7.23 (we assumed)
Step7: Calculate Critical value
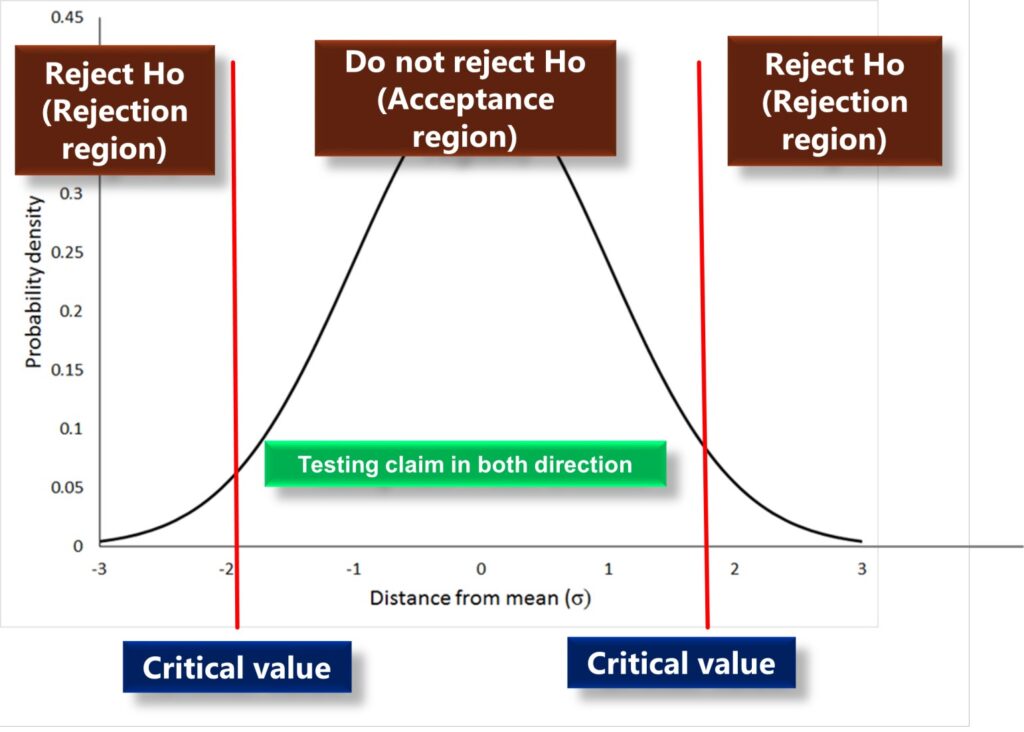
The critical value is a point on the distribution of the test statistics under the null hypothesis that defines a set of values that call for rejecting the null hypothesis. In simple language, critical value helps us to understand where our test statistics value falls on the distribution curve.
For all types of parametric and non-parametric tests, we have to calculate the Critical value. This value was calculated using the critical value table of the respective hypothesis test. To find critical value for Z-test we need to use Z-table, for T-test we need to use T-table and like that.
The critical value is the point on the distribution curve that separates the null hypothesis rejection region and acceptance region. see below. One tail test has only one critical value and two-tail tests have two critical values.
By comparing the test statistic value with the critical value we can determine whether to reject the null hypothesis or accept it. There is one standard criterion that we need to follow while comparing the critical value with the test statistic value.
- Test statistic value > Critical value. means statistic value falls in the rejection region hence rejecting the null hypothesis.
- Test statistic value < critical value means statistic value falls in the acceptance region and hence failed to reject the null hypothesis.
Sew if you do not understand this right now don’t worry because in the upcoming articles I am going to explain how to calculate test statistics value and critical value for each type of hypothesis test with examples. Here you should only focus on the sequence of hypothesis testing steps. Right!

Come back to the example, the manager calculated the critical value using Z-table because he is performing Z-test, and the critical value = 1.96. Now Z-test stat value = 7.23 and critical value = 1.96 so the manager concluded that the statistic value falls in the rejection region hence rejecting the null hypothesis. (As per criteria)
This is not the final conclusion because the manager needs a p-value to support this decision as the p-value provides evidence against the null hypothesis.
Step8: Calculate P-value
We already discussed the concept of P-value in detail, this can be calculated using software like Minitab and excel or we can calculate it manually. It will provide us with strong evidence against the null hypothesis whether to reject it or not.
Now after performing the hypothesis test, the manager got the P-value equal to 0.03 which is less than the alpha level of 0.05 so as per the criteria manager will decide the final decision in the next step.
Step9: State the statistical solution
As P-value is less than the alpha level then as per the criteria manager rejected the null hypothesis and accepted the alternate hypothesis or claim.
Step10: State the practical solution
As the null hypothesis was rejected, the manager concluded that the mean diameter of all rods is not equal to 6 cm.
That’s how hypothesis testing performs, here we just understood the basic framework of hypothesis tests like what are the different assumptions you need to consider, how to follow the 10-step procedure of hypothesis tests etc.
Still, there are many things to learn about hypothesis testing in statistics so I will come up with some more articles on this topic that will help you perform all types of hypothesis tests and interpret its results easily.
Conclusion-
Hypothesis testing in statistics is the best fact-based decision-making methodology. It helps many businesses to avoid errors while making billion-dollar decisions.
In this article, we covered all the important terminologies used in hypothesis testing in statistics along with different types of tests and 10 step procedure to perform the test with one simple example.
Well, the focus of this article is to make your fundamentals strong and I hope you got some new knowledge through this article. If you like this then please share in your network and subscribe to get more such content.


Hello Ashwin,
This is a well-written article that i would recommend to any Green Belt as well as a Black Belt to read. This is also helpful for someone at the college level studying Statistics 101.
Now while you do state as if a point of fact that makes it sound as if this is the only path, there are many alternative path and much more to learn but this is a good foundation. For example: the P-value is not the only thing you look at to determine if your hypothesis is true. It depends on the test. for example, in Regression you are looking at the R-sq or R-squared (adjusted). there are also residuals that mey be indicating the model may not be the best fit. The assumptions for each test are also very important, such as sample size, the power of the test, the randomness of the data, the measurement system error is low, the distribution of the data, the stability of the data, and lets not forget the meaningfulness or usefulness in the data.
But your article is already quite long and to cover all of the above would take many more articles. so as you add more content, hyperlink words to this and other articles to show the relationships to these other topics.
Great job and thanks for sharing,
Respectfully Steven Bonacorsi, Lean Six Sigma Master Black Belt
Thanks for your feedback sir!
Pingback: Hypothesis test: how to perform step by step?
Pingback: What is 8D problem solving? Complete guide for 2022
Pingback: What is Parametric tests? Complete guide for 2024