

A hypothesis test is the heart of all inferential statistics, statistics that allow us to make inferences about the world. This powerful analytical tool is used in multiple fields like research, business problem solving, healthcare, science, engineering, etc. to make data-based decisions.
So where there is data and a need for data-based decisions, hypothesis tests are useful. In the Lean Six Sigma project also, we need to make a data-based decision for process improvement, during that project work practitioner uses the hypothesis test in the Analyze phase of the DMAIC approach.
DMAIC is the 5 step approach used in Lean Six Sigma for process improvement. During the 3rd step i.e. Analyze phase, the hypothesis tests help the practitioner makes data-based decisions for improvement.
Being a Lean Six Sigma Black belt, I would like to help you understand the practical application of this tool in the Lean Six Sigma project. In this article, we are going to understand how to conduct a hypothesis test step by step with the help of one real-life example.
In the end, you will be in a position to use this tool/method and interpret its final results as well as make data-based decisions easily. So let’s begin…
What is Hypothesis testing?
A hypothesis test is a statistical tool used to draw conclusions based on data. With a basic understanding of the process and process performance as well as real-time data, the Six Sigma project team can draw a statistical conclusion that is extremely accurate.
This tool is used during the analyze phase of the Six Sigma DMAIC project approach, to test the data collected during the measure phase. In simple words, It is the statistical analysis in which analysts/lean six sigma practitioners test the claim made about the population parameter and verify the correctness of the claim.
As you know Lean Six Sigma is a data-driven methodology this tool is very useful during the Six Sigma project to make data-based decisions. While doing a six sigma project your goal is to improve process capability.
If you translate the goal into a statistical language then that is nothing but to improve the process mean and reduce the Standard deviation.
To do this you need huge population data but it is very expensive and impractical to collect population data and make decisions based on population data. It’s not capable to test the entire population. So the easy and cost-effective option is to make decision-based on sample data.
While dealing with the sample data, there is some uncertainty about the true population parameters. In order to overcome this uncertainty, you can use a hypothesis test to make a decision based on the statistical inference that uses data from a sample to draw a conclusion about the population parameter.
This is one of the powerful problem-solving tools used during an improvement project that converts a practical business problem into a statistical problem to find its solution.
The basic purpose of a hypothesis test is to integrate the voice of the process with the voice of business to make data-based decisions to resolve problems. (Related content – Practical meaning of hypothesis testing)
Important terms you need to know while performing the hypothesis test –
Before starting the hypothesis test example, let’s have a quick overview of fundamental terms used in hypothesis testing. I am not going into the details about these terms because the focus of this article is to understand the hypothesis testing procedure.
So go through these terms and if you understand all these then go ahead but if you want to understand these terms in detail then I have one comprehensive guide on hypothesis tests for you, that will help you understand these terms with the help of some practical examples.
You will find the link of that complete guide at the end of this topic. (1st go through these definitions)
- Types of hypothesis tests – There are two main types of hypothesis testing i.e. Parametric and Non-parametric tests. Parametric tests are used when the data is normally distributed and you want to compare the means of sample data (Z-test, T-test, Paired test, 2 sample test, and ANOVA).
- On the other hand, Non-parametric tests are used when the data is not normally distributed and you want to compare the medians of the sample data. (Sign test, Wilcoxon test, Man-Whitney test, Moods Median test, Kruskal Wallis test, Friedman test)
- Null and Alternate hypothesis – Two hypothetical conditions you need to define at the start of a hypothesis test. Null hypothesis (Ho) means default assumptions or existing facts. The alternate hypothesis (Ha) means the research hypothesis or claim to test.
- One-tailed and two-tailed tests – The hypothetical analysis which tests the claim one-sided or in a specific direction is called a one-tailed test. On the other hand, the hypothetical analysis which tests the claim two-sided or in both directions is called a two-tailed test.
- Type I and Type II error – Type I error is a producer’s risk, it occurs when we reject the null hypothesis but it is true in reality. On the other hand, Type II error is a consumer’s risk, it occurs when we fail to reject the null hypothesis but it is false in reality.
- Alpha risk and Beta risk – Alpha risk is the probability of making a Type I error or the probability of rejecting a null hypothesis when it is true in reality. On the other hand, the Beta risk is the probability of making a Type II error or the probability of failing to reject a null hypothesis when it is false in reality.
- P-value in hypothesis testing – The p-value helps us reject or support the null hypothesis and graphically it is the area in the tails of the distribution. (If P value >= 0.05 then fail to reject null hypothesis, If P value < 0.05 then reject null hypothesis)
These are some of the important basic concepts in hypothesis testing. While performing any type of test you need to know these concepts to interpret the final results accurately. I have just given the overview of these concepts here, by assuming that you are already familiar with hypothesis testing.
But if you are unable to understand these concepts then before going ahead I would recommend you to go through the complete guide on hypothesis tests and get your basics cleared first, then come back to this article again and learn how to perform the hypothesis test with the help of an example.
Read this first (Must for beginners) – Important concepts in hypothesis testing
How to perform the hypothesis test step by step?
Until now we discussed the fundamental concepts of a hypothesis test, now it’s time to learn the hypothesis testing procedure with the help of a real-life example.
See there are two ways you can perform any type of hypothesis test i.e. Manual method (using critical value) and the Minitab method (using P value).
Here we are going to understand the manual method because it is more difficult than the Minitab method. In the Minitab method, the software will do all the calculations, your job is to insert the data only and then follow the steps given in the Minitab software.
In the end, you need to just interpret the final result using the P-value. You can easily understand it if you follow the Minitab guidelines for the hypothesis tests.
On the other hand, the Manual method using critical value is a little bit complex because here you need to do some calculations to determine test statistics and critical value.
To reduce that complexity I am going to perform a hypothesis test using the critical value method on one real-life example. After that, it will become easy for you to perform these types of tests manually. Let’s start –
Example –
EALSS Academy claims that the working professional’s mean score in the Lean Six Sigma Green belt exam is greater than 82 marks with a standard deviation of 20. A sample of 81 working professionals is selected from the training batch and the mean score is 90 marks. At a 95% confidence level, is there enough evidence to support the claim? (Assume data is normally distributed)
Step – 1: State a practical business problem.
In this step, you need to define what is the practical business problem (in the business context). In this example, the practical problem is we want to test whether the working professional’s (who appeared for the exam) mean score in the Lean Six Sigma Green belt exam is greater than 82. This is nothing but the claim we are going to study and find a practical solution for that.
Step – 2: State the statistical problem.
2nd step is all about converting the practical problem into a statistical problem so that it becomes easy to understand. Converting into a statistical problem means we need to define the null and alternate hypothesis conditions for this problem.
As you know, the null hypothesis is the default assumption and the Alternate hypothesis is a claim to test, so here the conditions are –
Null hypothesis (Ho): Ms = 82 marks (where Ms = Mean score in the exam)
Alternate hypothesis (Ha): Ms > 82 marks
Here the claiming is one-directional (Ms > 82 marks) so this example is a one-tailed test where we need to test mean score in the exam is greater than 82 or not.
Step – 3: Select Alpha and Beta levels:
As given in the problem, the confidence level is 95% which means the significance level (alpha level) is 5%. Alpha level = 1- confidence level = 1- 0.95 = 0.05 = 5 % . The beta level is generally considered as 0.10 = 10% for any type of hypothesis test.
Step – 4: Determine the sample size and collect data
Here Sample size given in the problem is 81 means as analysts we need to assess the exam score of 81 working professionals. Sample size (n) = 81 and the mean score of the sample (X bar) = 90.
Step – 5: Select the type of hypothesis test
In this step, we need to select the right type of hypothesis test to perform. Earlier we saw the two categories of hypothesis tests i.e. parametric and non-parametric tests. In these two categories, there are 5 to 6 different types of hypothesis tests. Depending upon the type of data we need to select the right type of hypothesis test.
Use Parametric tests – when data is normally distributed
Use a Non-parametric test – when data is non-normally distributed
In this example, it is given that data is normally distributed so we need to use parametric tests. In the parametric category also there are z test, t-test, paired test, and Anova. All these tests are useful based on some criteria –
- Z test – when comparing the sample mean with the target mean (provided that standard deviation is given and sample size >30).
- T-test – when comparing a sample mean with the target mean (provided that standard deviation is not given and sample size < 30).
- Paired test – when comparing two dependent samples mean with each other.
- 2 sample tests – when comparing two independent samples mean with each other.
- ANOVA – when comparing more than 2 independent samples mean with each other.
In our example, we need to compare the mean score in the exam with the target mean (82) and the standard deviation is given and the sample size is also greater than 30 (n – 81). Hence as per the criteria, we are going to use 1 sample Z test.
Step – 6: Calculate the test statistic value
Test statistic value is the standardized value calculated using sample data while performing a hypothesis test and in the manual method, it helps in rejecting the null hypothesis. All the types of hypothesis tests have their own test statistics and have different ways to calculate using formulas.
For this example, we are going to focus on the Z statistic value (test statistic for Z test). There is a standard formula to calculate the Z statistic value.

Step – 7: Calculate the critical value
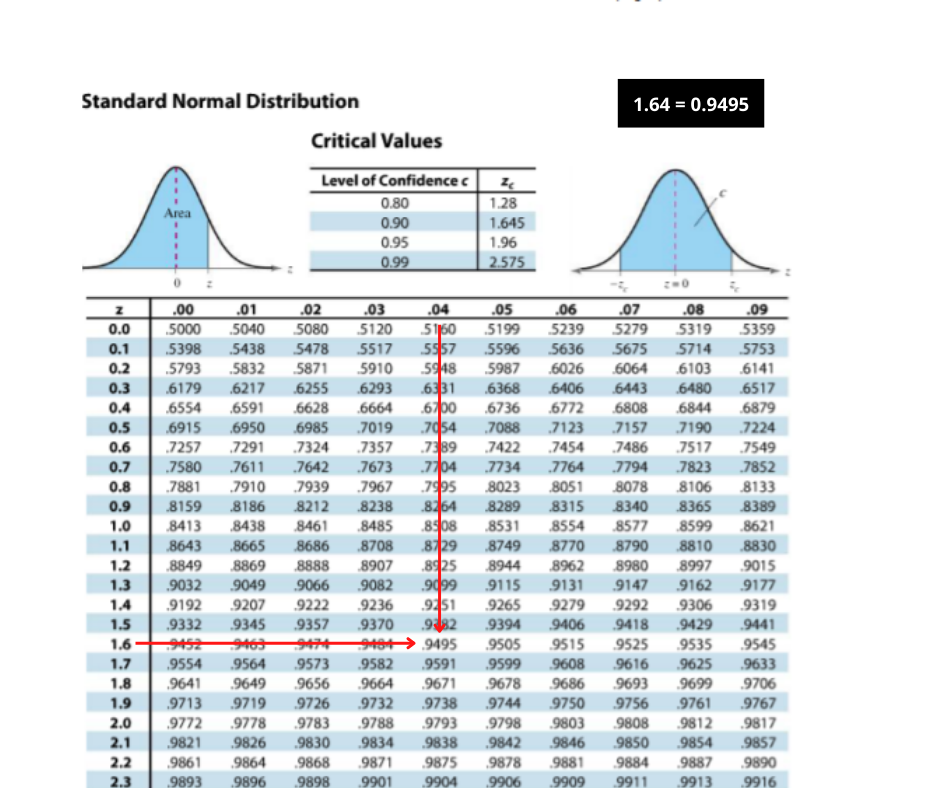
The critical value is the point on the distribution curve that separates the null hypothesis rejection region and the acceptance region. It helps us understand where our test statistics value falls on the distribution curve. To find out this value we need a critical value table that is different for different types of hypothesis tests.
For the Z test, we have the Z table, for the T-test we have the T table and like that. To find the critical value for a 1- 0.05 = 0.95 in the Z table (see below). i.e. 1.64 = Z critical value
Step – 7: Statistical solution
Now we have Z stat value = 3.63 and Z critical value = 1.64 so the rejection criteria for the null hypothesis is –
Z stat > Z critical then reject the null hypothesis.
Z stat < Z critical then fails to reject the null hypothesis.
In our example, Z stat > Z critical i.e. 3.63 >1.64, Z stat value is in the rejection region hence we can reject the null hypothesis.

Step – 8: Practical solution
We rejected a null hypothesis means the Mean score in the Lean Six Sigma Green belt exam is not equal to 82 marks and there is enough evidence to support the claim that mean score in the Lean Six Sigma Green belt exam is greater than 82 marks (Ms > 82).
That’s how you can perform a hypothesis test using the critical value method. Same steps you can follow for any type of hypothesis test and use respective tests table as well as formulas to calculate test statistic value and critical value. Then you can easily interpret the final results.
Conclusion –
Hypothesis test is a powerful analytical tool that helps you make data-based decisions with minimum error. It also helps avoid the high costs of experimental efforts by using existing sample data. Understanding this tool will help you a lot in your process improvement projects.
In this article, we discussed hypothesis testing fundamental concepts and how to perform a hypothesis test step by step using one practical example and also discussed how to calculate test statistic value and critical value and then interpret the final result of a test.
I hope you got the clarity on the hypothesis testing procedure. If you found this article useful then please share it in your network and subscribe to get more such articles every week.

hi
good afternoon
very nice and useful site
regards
Ahmad Khavari
KSS Black Belt
Thanks for your feedback!