

P-value in hypothesis testing is the key element of decision making. Whatever results we will get after performing a hypothesis test, it ends up to meaningful decision with the help of P-value. This value helps us to provide the practical conclusion at the end of any type of hypothesis test.
Most Six Sigma learners and data scientists have confusion regarding the P-value and they are unable to understand its meaning and how to interpret this value. Well, I know for beginners it’s really confusing but with some practical examples, you can understand it easily.
That’s why in this article I am going to discuss P-value in hypothesis testing in detail with some real-life examples. So at the end, you will understand its exact meaning and how to interpret it while performing a hypothesis test. Overall this article ends your confusion regarding P-value forever. Let’s begin…
What is P-value in hypothesis testing?
Hypothesis testing is used in different fields like research work, business decision making, problem-solving, Six Sigma projects, Medicine study, etc. It is used when there is a need to make data-based or fact-based decisions making. So to get the best results from hypothesis testing we need a P-value.
Importance of P-value in hypothesis testing –
P-value is an abbreviation for probability value. It is a value or number between 0 and 1. The official definition of P-value is quite difficult to understand. See below that definition and try to think what it says…
” A P-value is the probability of obtaining the observed difference or a larger one in the outcome measure, given that no difference exists between treatments in the population.” I am sure after reading this most of you feel like “OMG” what is this? Don’t worry let’s make it easier to understand the P-value with the help of a real-life example.
(Carefully read this) Suppose I have two drugs drug M and drug N and I want to know if drug M is different from drug N. So I give one person drug M and one person drug N, the one person using drug M is cured, on the other hand, the person who using drug N is not cured. Can we conclude from this that drug M is better than drug N? ‘Definitely NO’.
Because Drug N may failed for a lot of different reasons like maybe the person who is taking medication has a bad interaction with drug N or may this person has a rare allergy to drug N or maybe this person didn’t take the dose properly.

Similarly for drug M, maybe this drug doesn’t actually work and the person who is taking this drug is cured because of the placebo effect. There are a lot of weird, random things that can happen when performing this test of comparing drugs M and N. That means we need to try each drug on more than just one person each to get more evidence.
This time instead of testing drugs M and N on two or three-person, we need to test the drugs on a lot of different people. So this time we tested it on a lot of people and got the results below –

See the results drug M cured a whole lot of people i.e 1043 and only 3 people didn’t cure by drug M that means an overall 99.7% of the 1046 people using drug M were cured. In contrast, drug N only cured 2 people out of 1434 and all remaining 1432 people didn’t cure which means overall only 0.001% of the 1434 people using drug N were cured.
By seeing this result we can definitely say that the drug M is better than drug N. It is unrealistic to say that this result occurred by random chance, it may possible that in the case of drug M some of the people out of 1043 were cured by placebo effect without the actual dose.
Similarly, in the case of drug N, some of the people out of 1432 were not cured because of some rare allergy, it’s not the complete fault of drug N. From this we can’t be 100% sure, drug M is no better or worse than drug N.

Now see the other scenario, for drug M, if out of 198 people, 73 get cured and 125 are not cured by drug M that means only 37% of people that took drug M were cured. On the other hand, if out of 190 people, 59 get cured and 131 are not cured by drug N that means only 29% of people that took drug N were cured.
So from this, we can say that drug M cured a larger percentage of people than drug N (37% >29%). But as we know that no study or experiment is perfect and there are always a few random things that happen during hypothesis tests.
How confident can we be that drug M is superior or better than N? That’s where the P-value in hypothesis testing comes. P-value quantifies (P-values are numbers from 0 to 1) how confident we should be that drug M is different or better than drug N.
That’s the importance of p-value in every hypothesis test or data-based research study because it gives confidence to our final decision.
Statistical meaning of P-value –
In statistical language, the idea of trying to determine if these drugs are the same or not is called hypothesis testing. P-value plays an important role while making the final decision about hypothesis testing results. P-value helps us to reject or support the null hypothesis statement.
P-value is probability of null hypothesis being true.
For example in the above example, our hypothetical conditions are –
- Null hypothesis – Drug M and N are the same.
- Alternate hypothesis – Drug M and N are different.
Read more – What is null and alternate hypothesis means?
In more simplified language, while comparing these two drugs M and N what we did? we initially collected the data of how many people were cured. and then in the end by calculating P-value we can interpret whether these two drugs are the same or different. That’s the actual use of P-value in any research or analytical study.
This value basically provides evidence against the null hypothesis, the smaller the p-value stronger the evidence that you should reject the null hypothesis, and the higher the p-value that means you should reject the alternate hypothesis. So at the end of every hypothesis test, you will get the p-value then you need to make the final decision.
Now the question comes what threshold can we use to make a good decision? means on what basis we can say that the null hypothesis statement is wrong or alternate hypothesis statement is wrong? Well, to support that decision we have to compare the P-value with the standard threshold value of 0.05. This threshold value is called as alpha level.
There are standard criteria for P-value that help us to decide when we need to reject the null and alternate hypothesis. As per that criteria we need to compare the P-value with the alpha level so at the start of hypothesis testing analyst considers the alpha level like 5%,1%, etc. (Standard practice)
Then in the result, we need to calculate the P-value. To make the final decision P-value needs to be compared with the assumed Alpha level. That’s the last step of any hypothesis test. See the standard criteria –
- If P-value >= 0.05 (alpha level) then reject the alternate hypothesis or failed to reject the null hypothesis.
- If P-value < 0.05 (alpha level) then reject null hypothesis.
Graphical meaning of P-value –
Graphically, P-value in hypothesis testing is the area in the tails of the distribution. For the 1-tail test, it is the area on the tails of the distribution either on the left side or right side depending upon the type of 1-tail test. On the other hand, for the 2-tail test, it is the area on the tails of distribution for both sides.
Check out – Meaning of One-tailed test and Two-tailed test
Graphically “P-value means the probability of obtaining a sample more extreme than the ones observed in your data, assuming that the null hypothesis is true.” let’s make it more clear to understand –
You know while performing a hypothesis test we define a null and alternate hypothesis at the start and then collect data, analyze it to make the final decision. We collect sample data for any research study like 30 samples or 40 samples all that have different values.
Then we find the mean of all the sample data to compare that’s what hypothesis testing does. We have a collection of sample data for the study, then the p-value is giving the representation of what would be the likelihood of getting data even more extreme than the ones that actually collected.
In the case of one tail test my data more extreme means either in the right or left direction of distribution similarly in case of 2 tailed test my data more extreme means on both sides of the distribution.
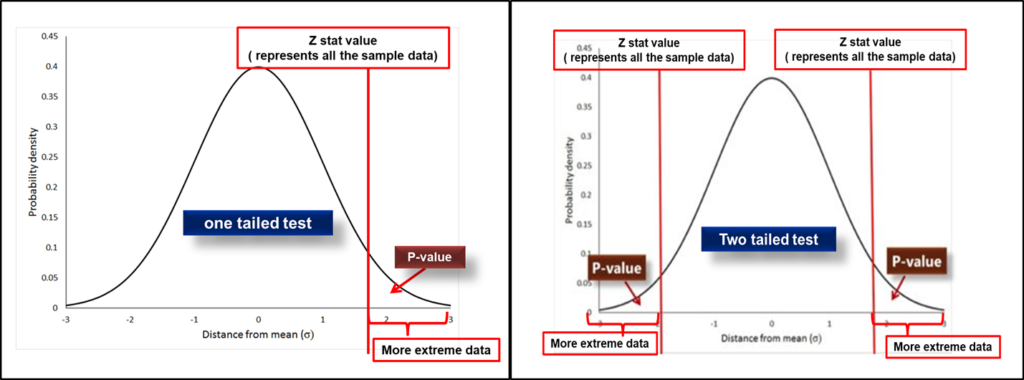
See the image of the 1 tail test showing the p-value graphically. Similarly, for 2 tailed test that’s how the p-value shows graphically. While calculating the p-value we need to check whether the test is one-tailed or two-tailed because on the basis of the type of test further calculation will be done.
How to calculate P-value in hypothesis testing-
Till now we understood the fundamental meaning of P-value, what it actually and how important it is while performing hypothesis testing. It is easy to calculate p-value using software like Minitab, excel, sigmaXL, etc. but its manual calculation is a little bit confusing.
To find it manually, we have to use different score tables depending on the type of test we performing like the Z score table, T score table, Chi-square table, etc. P-value in hypothesis testing is calculated with the help of Z-score value by using a standard normal table, with the help of T score value by using t- distribution table,
Similarly, with the help of the Chi-square score and f-ratio score value for the respective test, we can calculate the p-value. For this article, I am going to give you an example of how to calculate a p-value using a Z score so that you will get a basic understanding.
- Check out – Quick P-value calculators.
Example P-value using Z-score –
Suppose, John read an article that said 26 % of Indians can speak more than one language. He was curious if this figure was higher in his city (Mumbai), so he tested H0: Po = 0.26 and Ha: Po > 0.26 (where Po is the assumed sample proportion of people in his city that can speak more than one language)
He found that 50 out of 120 people sampled could speak more than one language. Now calculate P-value for the test and conclude the final decision for the alpha level = 0.05. ( right-tailed test)
Answer (see the steps) –
Step -1: Find out the z statistic value using the formula.
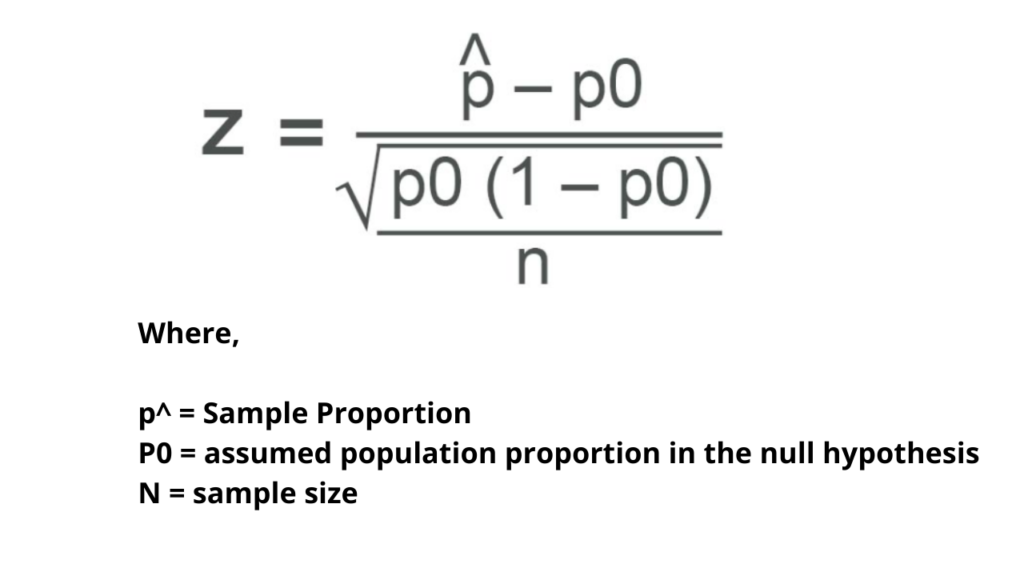
John found that 40 out of 120 people could speak more than one language so sample proportion = 40 /120 = 0.33 then sample size = 120 and assumed proportion = 0.26. Put all the values in the given formula.
Z stat = (0.33 – 0.26 ) / √ 0.26 ( 1-0.26) / 120 = 0.07 / 0.04 = 1.75 hence Z stat = 1.75
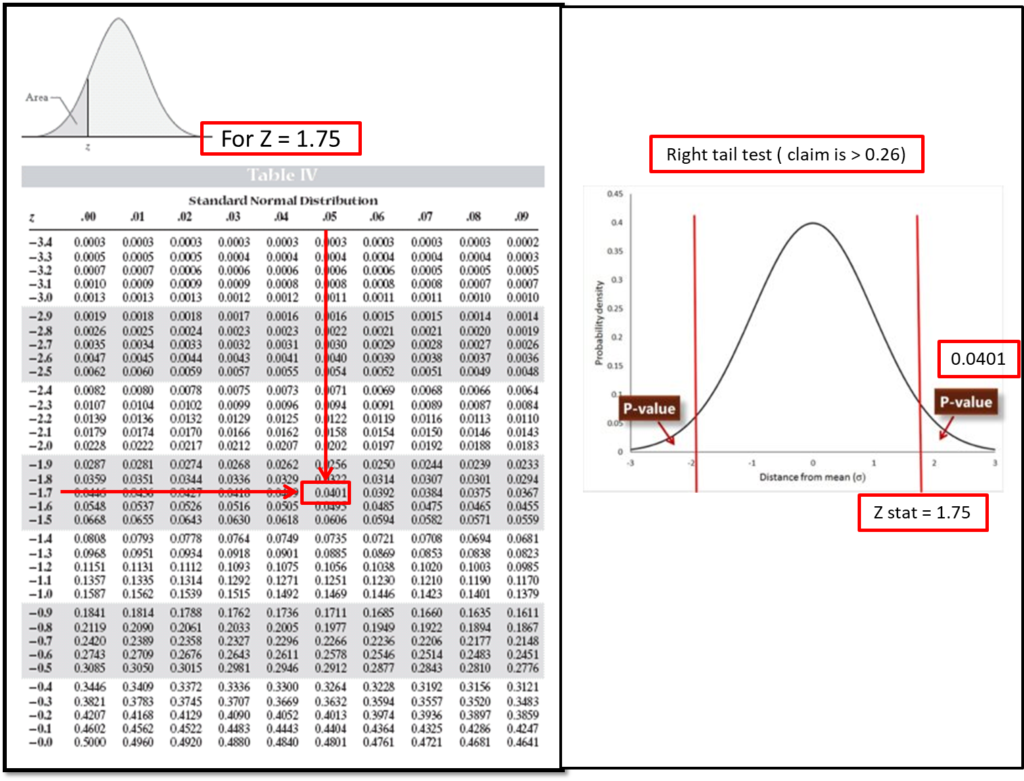
Step – 2: Find the corresponding level of P-value from the z stat value obtained.
Here we have to find the P-value which is equal to what is the probability of getting Z value greater than or equal to 1.75 (P-value = P (Z ≥ 1.75 ). See the Z table below – Since the normal distribution is symmetric the negative values of Z are equal to its positive values hence look at 1.70 in the Z column and the corresponding value of 0.05.
We got a p-value = 0.0401
Step:3 – Interpret the final result
P-value = 0.0401 (means there is a 4.01% chance that the final result could be random or happened by chance) Let’s compare with the alpha level of 0.05. As per rejection criteria P-value < 0.05 (0.0401< 0.05) means we should reject the null hypothesis.
Final conclusion is “the proportion of people in his city that can speak more than one language is not equal to 0.26 i.e greater than 0.26.”
That’s how the P-value is calculated using the z stat value, similarly, you can calculate using t stat value, chi-square stat value, etc. We will see how to do this in upcoming articles.
One thing you should make sure that while using tables for P-value calculation check whether the test is 1 tailed or 2 tailed then use the respective table for accurate calculation.
Conclusion –
P-value in hypothesis testing is one of the most confusing concepts but I hope with this article your all the doubts got cleared. We covered every aspect of P-value like its importance in hypothesis testing, statistical and graphical meaning, then we understood how to calculate P-value manually and how to interpret it.
In the upcoming articles, we will see how to calculate P-value in hypothesis testing for different types of tests like t-test, chi-square test. F-test etc. Till then check out other articles and learn Lean six sigma daily.
If you find this article useful then please share it in your network and subscribe to get more such content.
Pingback: What is hypothesis testing in statistics? Complete guide
Pingback: Correlation coefficient: How to calculate using formula & Minitab?