

Have you ever found yourself grappling with incomplete or inaccurate types of data when trying to solve problems or working on process improvement projects?
Perhaps you have experienced the frustration of implementing a solution, only to realize later that it didn’t address the real issues.
Or maybe you have struggled to gain support from stakeholders and management for projects because your data lacked credibility or relevance. If any of these scenarios sound familiar to you then this article is for you.
Because the truth is without a proper understanding of different types of data and how they contribute to process improvement efforts, organizations risk making decisions based on guesswork rather than evidence.
This can lead to wasted time, resources, and improvement efforts. That’s why in this article, I will discuss in detail the 4 types of data that every Lean Six Sigma practitioner must know for process improvement.
By mastering these data types you can make informed decisions, identify root causes of problems, and drive meaningful change within your organization.
So are you ready to unlock the power of data and take your process improvement projects to new heights? Then Let’s get started…
Importance of Data for Process Improvement Projects
Imagine your organization experiencing a decline in product quality, leading to increased customer complaints and decreased satisfaction.
As a Lean Six Sigma practitioner, you have been tasked with leading a process improvement project to address the issue. Where do you begin? How do you identify the root causes of the problem and develop effective solutions?
You know the answer lies in understanding the different types of data available to you and knowing how to leverage each type effectively.
From qualitative to quantitative each type of data offers unique insights into your processes and can guide your improvement efforts in different ways. Data provides objective evidence to support decision-making.
Instead of relying on assumptions or opinions, process improvement projects use data-driven insights to identify issues, analyze root causes, and evaluate the effectiveness of solutions.
Data allows organizations to identify areas of inefficiency, waste, or defects within their processes. By analyzing data, organizations can pinpoint specific areas where improvements can be made to enhance performance, quality, and efficiency.
It helps organizations understand how well their processes are currently performing. KPIs and metrics provide a quantitative measure of process performance, allowing organizations to assess performance against targets and benchmarks.
Data is also essential for conducting root cause analysis. By collecting and analyzing data related to process issues or defects organizations can identify the underlying factors contributing to these issues.
This helps them to address root causes rather than just treating symptoms. You know throughout the process improvement projects, data is used to monitor progress and track the impact of implemented changes.
By collecting data before, during, and after process improvements, organizations can assess the effectiveness of their efforts and make adjustments as needed.
Organizations can also identify new opportunities for improvement, measure the impact of previous changes, and iterate on their processes to drive ongoing enhancements.
So, data is the foundation upon which all decisions and improvements are made. Without data process improvement efforts would lack the necessary evidence and insights to drive meaningful change and achieve sustainable results.
For process improvement projects every Lean Six Sigma practitioner must know the 4 types of data that come under 2 important categories of data i.e. Qualitative (nominal and ordinary) and Quantitative (continuous and discrete).
Qualitative data provides descriptive information about processes while Quantitative data provides numerical measurements and metrics that can be objectively analyzed and compared. Let’s see these 2 categories one by one:
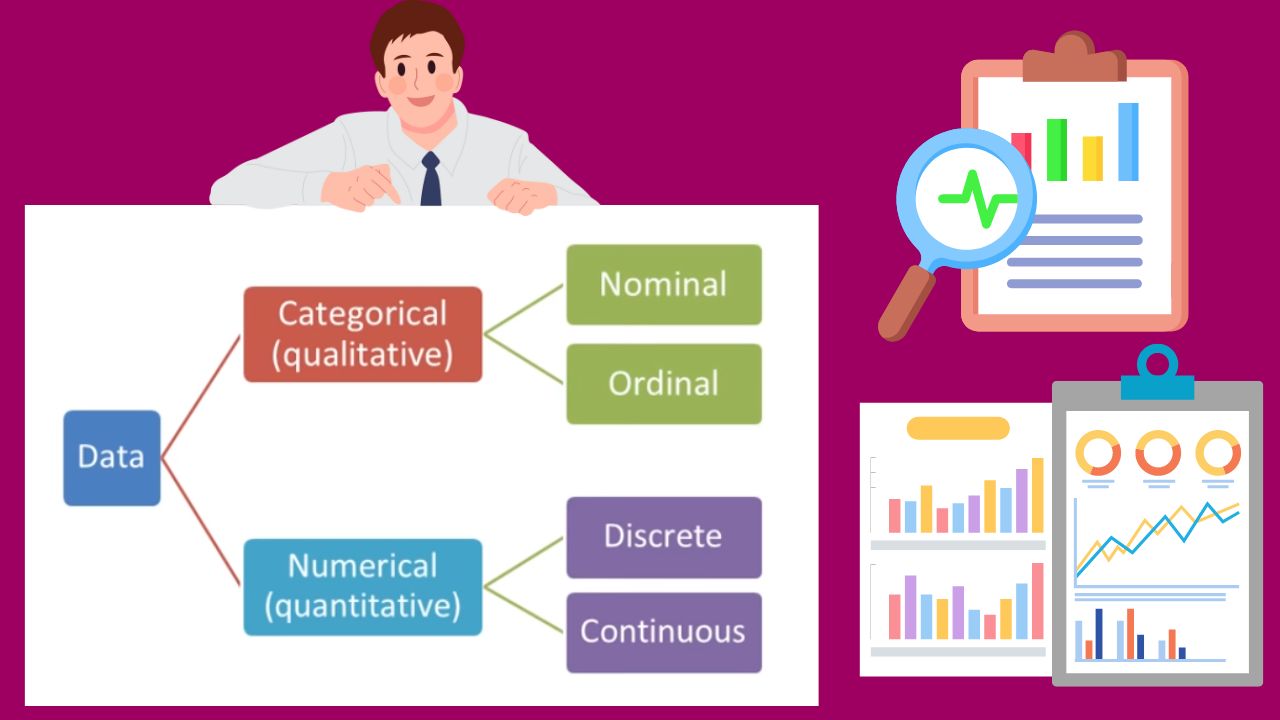
Qualitative Types of Data:
Qualitative types of data refer to non-numeric information that provides insight into the quality and characteristics of processes, products, or services. It captures qualities, attributes, or characteristics that cannot be easily quantified.
It provides depth and context to understanding phenomena and is often used to explore complex issues, attitudes, behaviors, and perceptions. This category is divided into 3 types of data Nominal, Ordinal, and Binary I will talk about it later.
See the main characteristics of this category of data:
- Subjectivity: Qualitative data often reflects the opinions, beliefs, or perspectives of individuals.
- Contextual richness: It provides detailed in-depth information about a particular phenomenon.
- Flexibility: Qualitative data collection methods allow for flexibility, and adaptability during data gathering processes.
Common sources of qualitative data collection include:
- Observations: Directly observing processes, behaviors, or interactions to gain insights into how they function.
- Interviews: Conducting structured or semi-structured interviews with stakeholders, process participants, or subject matter experts to gather qualitative insights.
- Open-ended survey responses: Analyzing responses to open-ended survey questions to uncover themes, patterns, or perceptions related to a specific topic.
- Focus groups: Facilitate group discussions with key stakeholders to explore different perspectives and gather qualitative feedback.
Examples of qualitative data:
- Detailed observations of employee interactions on the production flow.
- In-depth interviews with customers to understand their preferences and expectations.
- Analysis of open-ended survey responses to identify recurring themes or concerns raised by respondents.
- Insights are gathered from focus group discussions about potential process improvement.
Advantages and limitations of qualitative data types:
Advantages:
- Qualitative data provides detailed, nuanced insights into complex processes or issues.
- It helps in understanding the ‘WHY’ behind observed phenomena or you can process performance.
- Qualitative methods can be adapted to suit the specific needs of a project.
Limitations:
- Qualitative data may be influenced by the biases or perspectives of the collectors or respondents.
- Qualitative data collection and analysis can be time-consuming compared to quantitative methods.
- Findings from qualitative data are often context-specific and may not be easily generalized to larger populations.
1. Nominal Data
Nominal data represents different categories or labels without any inherent order or ranking. It is essentially a way of classifying information into distinct groups or classes based on specific characteristics or attributes.
This data can not be arranged in an ordering scheme and no arithmetic operations are performed for nominal data, such as Colors (green, red, yellow), Blood groups (A+, B+, O+, AB+), Marital status ( single, married, divorced), etc.
Example of Nominal data:
- Classifying defects into different categories such as surface defects, edge defects, and dimensional defects.
- Categorizing products based on their specifications or feature codes such as A123, B456, and C689.
- Grouping process variables into distinct categories for analysis.
Nominal data is often represented and analyzed using tools like:
- A Pareto chart is used to prioritize and focus improvement efforts by identifying the most frequent categories or issues.
- Frequency distribution displays the frequency of each category in a dataset, providing insights into the distribution of data.
- Statistical tests are used to determine whether there is a significant association between nominal variables.
2. Ordinal Data
Ordinal data is a type of qualitative data where the values have a natural order or ranking but do not have a consistent numerical difference between them.
It represents categories that can be ordered or ranked but differences between data values either can not be determined or are meaningless.
Rankings, ratings, or scales where the categories have a clear order but the intervals between them may not be equal. Customer satisfaction ratings such as ‘satisfied’, ‘very satisfied’, ‘dissatisfied’, ‘neutral’, etc.
Here the difference between ‘very satisfied’ and ‘satisfied’ may not be the same as between ‘satisfied’ and ‘neutral’. Let’s see an Examples of Ordinal data:
- In customer surveys, ordinal data helps organizations understand customer preferences by ranking their satisfaction levels or preferences for different products or services.
- In performance evaluation, ordinal data allows managers to rank employees based on their performance levels or achievements.
3. Binomial Data
This is one of the types of qualitative data that has only two possible outcomes or categories (Yes/No, Success/Failure). It is characterized by a discrete nature and the presence of a fixed number of observations.
These outcomes are mutually exclusive meaning that only one of the two outcomes can occur for each observation, and together they cover all possible outcomes.
Example of Binomial data:
- Determining whether a product is defective or non-defective based on sample inspection.
- Classifying customer responses as either ‘satisfied’ or ‘unsatisfied’ after a service interaction.
- Assessing whether each unit produced meets quality standards or not.
- Recording whether each patient in a clinical trial experiences a specific side effect or not.
Binomial data is often represented and analyzed using graphical tools like:
- A bar chart can visually display the frequency or proportion of each outcome (success or failure) in the dataset.
- A pie chart can illustrate the distribution of outcomes by representing each outcome as a segment of the pie, with the size of each segment proportional to its frequency.
- Control charts such as P or Np charts are commonly used to monitor the proportion of defective items in a process over time.
- Like continuous data, histograms also provide a visual representation of the distribution of binomial data.
Quantitative Types of Data:
Quantitative types of data refer to the information that can measured and expressed numerically. It deals with quantities, amounts, and numerical values, making it objective and precise.
It is characterized by its numerical nature, allowing for precise measurement and analysis. It provides quantitative information about a process, product, or service and enables objective assessment and comparison.
This data is structured, organized, and suitable for statistical analysis. Also useful in identifying trends, patterns, correlations, and cause-and-effect relationships. This category is divided into 2 types of data continuous and Discrete I will talk about it later.
Common sources of quantitative data collection include:
- Measurement data from process outputs such as cycle time, defect dimensions, or product specifications.
- Count data such as the number of defects, errors, or occurrences within a process.
- Numerical data related to performance metrics like customer satisfaction scores, production yields, or financial figures.
Examples of quantitative data:
- The duration required to complete a specific task or process step (cycle time).
- The number of defects identified per unit of production or service delivered (defect rates).
- Numerical ratings are provided by customers to assess their satisfaction levels (customer satisfaction score).
- The percentage of defect-free products or outputs produced within a process (yield rates).
- Quantitative measures of financial performance such as revenue, costs, or profitability ratios (metrics).
Advantages and limitations of quantitative data types:
Advantage:
- Quantitative data offers an objective and measurable basis for analysis reducing subjectivity and bias.
- Numerical values provide precise measurements, facilitating accurate comparisons and assessment.
- Quantitative data allows for detailed statistical analysis to get deeper insights and predictions.
- Quantitative metrics can be tracked over time and allow for the monitoring of process performance and improvement trends.
Limitations:
- Quantitative data may lack context and fail to capture qualitative aspects or nuances of a process.
- The accuracy and reliability of quantitative data may compromised by measurement errors or data collection issues.
- Some aspects of performance such as creativity or innovation may be challenging to quantify accurately.
- Quantitative data alone may not provide a comprehensive understanding of complex processes or customer needs.
1. Continuous Data:
Continuous data refers to any type of data that can have an infinite number of possible values within a given range. This type of data can be measured with precision and there are no distinct categories or breaks between values.
Continuous data can take on any value within a range, including fractions and decimals. It is often represented by real numbers and is typically collected through measurement or observation processes.
Example of continuous data:
- Measurement of process cycle time such as time it takes to complete a task or produce a unit of a product.
- Product dimensions such as length, width, and height which can be measured with precision using tools like calipers or micrometers.
- Temperature readings, pressure levels, weight measurement, etc.
Continuous data is often represented and analyzed using graphical tools like:
- Histograms provide a visual representation of the distribution of continuous data by grouping values into intervals or bins and displaying the frequency of observation within each interval.
- Box-plot provides a graphical summary of the distribution of continuous data, including measures of central tendency and variability.
- Control charts are used to monitor and analyze the variation in continuous data over time, helping to identify patterns, trends, and outliers.
2. Discrete Data:
Discret data consists of individual, separate values that can be counted and categorized. It refers to the information that can only take on specific, finite, or distinct values and cannot be broken down into smaller units.
This type of data is often associated with categories, classifications, or counts of occurrences. Let’s see some examples of this data type:
- Number of defects in a manufacturing process.
- Number of customer complaints received in a month.
- Production batch sizes.
- Number of products sold in a day.
- Number of employees in the department.
- Total player in a team.
- Days in a week.
Discrete data is often represented and analyzed using graphical tools like:
- Bar charts are useful for visualizing the frequency or distribution of discrete data categories with each bar representing a specific category and the height of the bar indicating the frequency or count.
- Pareto charts are used to prioritize improvement efforts by identifying the most significant categories contributing to a particular outcome.
- Run charts can be used to track changes in discrete data over time, providing insights into trends and patterns.
If you want to learn data analysis for your process improvement project and get certified in Lean Six Sigma then I would like to recommend the best practical live training program check out – Lean Six Sigma with Minitab live training program and certification.
Conclusion
Mastering these 4 types of data is crucial for effectively identifying root causes, measuring process performance, and making informed decisions. This empowers you to make data-driven decisions, mitigate risks, and achieve sustainable results.
All 4 types of data offer unique insights and challenges, but when used in conjunction, they provide a comprehensive understanding of the process landscape.
By harnessing the power of data, you can unlock new opportunities for innovation, efficiency, and excellence in every aspect of your organization.
If you found this article useful then please share it in your network and subscribe to get more such articles every week.


